This site uses cookies to improve your experience. To help us insure we adhere to various privacy regulations, please select your country/region of residence. If you do not select a country, we will assume you are from the United States. Select your Cookie Settings or view our Privacy Policy and Terms of Use.
Cookie Settings
Cookies and similar technologies are used on this website for proper function of the website, for tracking performance analytics and for marketing purposes. We and some of our third-party providers may use cookie data for various purposes. Please review the cookie settings below and choose your preference.
Used for the proper function of the website
Used for monitoring website traffic and interactions
Cookie Settings
Cookies and similar technologies are used on this website for proper function of the website, for tracking performance analytics and for marketing purposes. We and some of our third-party providers may use cookie data for various purposes. Please review the cookie settings below and choose your preference.
Strictly Necessary: Used for the proper function of the website
Performance/Analytics: Used for monitoring website traffic and interactions
Almost two years ago with knowledge of the problems of the freight industry and some rough ideas of how to solve them, we’ve been able to plot, survey, and develop the systems we’ve now launched. 2018 was full of progress and challenges, but we are so excited to have kicked off 2019 with one of our greatest achievements to date.
As this year’s survey results show, respondents are rolling up their sleeves and coping with change by leveraging additional technology, as well as by increasing attention on training, pay rates and data quality.
Wednesday, July 10, 20192019 Warehouse Robotics Usage Increases to 25% Supply chain consultancy EFT has reported 7% more survey respondents are testing robotics in selected warehouses in 2019, up from 18.4%
The use of predictive analytics in supply chain operations rose by 76% from 2017 to 2019 , according to surveydata. According to CBRE, the industrial availability rate stayed essentially even in the first quarter of 2019 after years of steadily dropping. before any new legislation can go into effect.
The world’s first in-water remote ship surveys using a remotely operated vehicle (ROV) have been completed by leading classification society, DNV GL. The latest in-water survey of this kind was performed earlier in July on another ASA Wilson-managed vessel in Bergen, Norway.
And as of late 2019, 60% of consumers were already spending up to one-third of their average grocery budget on fresh items, according to Deloitte Insights. In a survey of retailers and wholesalers conducted from mid-March to mid-April, 81% said sales in the perimeter had increased over the previous 12 months.
After several years in a row of warm rather than meteoric growth, there are fewer people making that claim for 2019. To learn more about our IoT predictions for 2019, read on: A Simplified Market Will Spur IoT Growth. 2019 is when we’ll see the real growth in the market that has been forecasted for years,” he said. The reason?
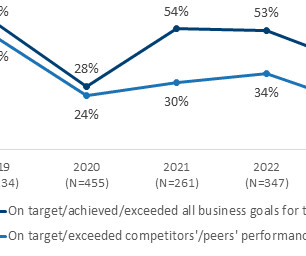
In fact, two-thirds of the companies we surveyed characterized their omni-channel fulfillment performance (relative to peers in their industry) as average or below, with 30 percent characterizing it as below average. That said, as we further evaluate the data we find even Above Average Performers have significant room for improvement.
As a result, ARC Advisory Group and DC Velocity magazine have chosen to focus this year’s survey-based research on the changes logistics operations have experienced in the upheaval of the Covid-19 operating environment in 2020; and the expectations logistics executives have about their operating environment in 2021.
Supply chain leaders are struggling to find skilled workers, according to surveydata. higher than in March of 2019. and China has lowered grain shipping volumes in 2019. The company uses satellite imagery to monitor deforestation in palm oil production, and plans to extend this practice to paper and soy later this year.
In its “DHL 2019 Holiday Shipping Survey,” DHL collected data based on a survey sent to more than 4,000 customers as well as other U.S. e-commerce businesses. And, not surprisingly, the results and main takeaways provided more than a bit of food for thought to say the least.
Robinson’s own technology and data from the largest network in the freight industry, help our customers stay on top of the trends that influence their supply chains. As a researcher at Michigan State’s Broad College of Business, I will explain how I arrived at this figure, based on available data. Analysis of employment data.
Great Places to Work certifies companies through its rigorous, data-driven For All methodology, confirming that 95 percent of Trinity’s employees have a consistently positive experience as compared to 59 percent at a typical US-based company. . People, Team, and Culture were three of the top mentioned topics in Trinity’s GPTW survey. “We
Measuring a sample of more than 1 million items from five leading retailers and eight brand owners, the study also found that when RFID was not implemented, 69 percent of orders shipped and received from brands to their retailer partners contained data errors. Researchers anticipate Phase 2 will be completed in mid-2019. .
Then in 2019, the newly reorganized Defense Counterintelligence and Security Agency put special emphasis on protecting critical technology. First, it is done through surveys. But no survey-based mapping is ever complete. Initially, they provided risk solutions to financial services firms.
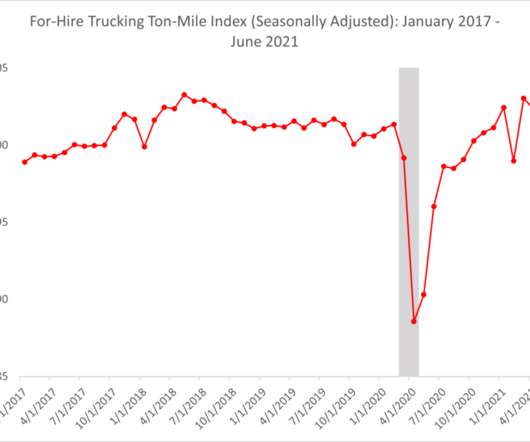
Just last month I noted that warehouse labor productivity was hindered extensively by COVID-19 and that 80 percent of ARC’s warehouse survey respondents anticipate an increase of order throughput volumes in 2021. Here are a few more data points supporting the ongoing labor needs of warehousing and transportation operations.
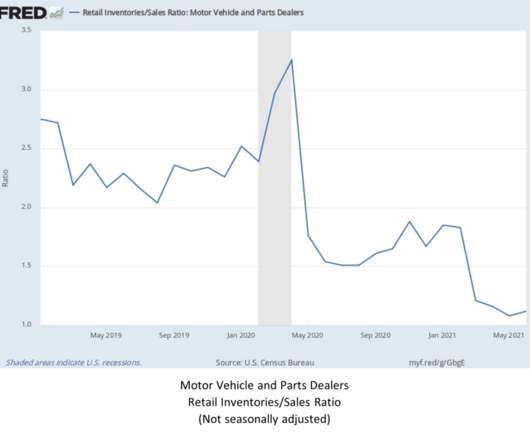
Data as recent as the end of June 2021 show that inventories remain below 1.3 times a month’s sales, a low for the period since January 2019 included in the chart. With that said, let’s take a look at some recent and more granular data on sales, prices, and supply chain performance. I question if this is a data anomaly.
Businesses are prioritizing the speed of data propagation within their supply chains. According to Gold, NRF members have made significant investments in data analysis to improve their ability to predict consumer demand to prevent bloated inventory levels that many large retailers experienced around this time in 2022. and Target Corp.
Our 2018- 2019 Network Design Survey showed that the majority of organizations are still relying on spreadsheets (nearly 60%) and gut feel (15%) to make network design decisions. How are companies leveraging scenario modeling for network design and optimization ? Read on for common use cases. .
To examine supply chain management priorities, performance, and anticipated trends, APQC conducted its 10 th annual Supply Chain Management Priorities and Challenges research, including a survey of more than 350 supply chain professionals from around the world and across multiple industries. For more information on the research, click here.
Several recent surveys show that automotive supply chains are highly susceptible to cyber attacks. Many companies lack internal teams or practices to combat data breaches. Others can’t enforce security standards on providers.
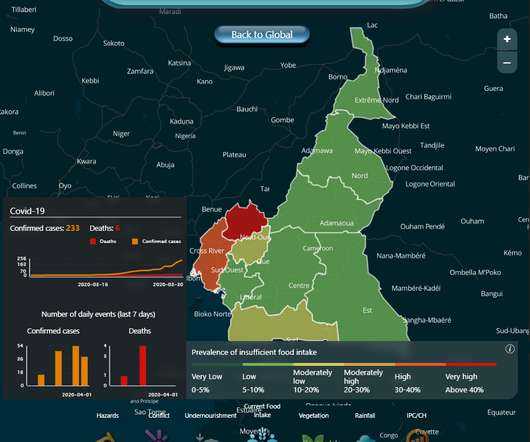
How data is boosting WFP’s response to COVID-19 Chief economist Arif Husain explains how cutting-edge tech is supporting assistance by agency and wider humanitarian community Deir Hafer, Syria?—?WFP data informs how we respond, prepare and adapt. Thanks to its data systems, WFP was able to target 1.7 and easily accessible?—?to
S till, most companies are “not very far” when it comes to implementing analytics and garnering benefits from data, as a recent survey from CSCMP suggests. I n many cases, organizations haven’t succeeded in making the organizational changes required to become data-driven. Source: CSCMP.
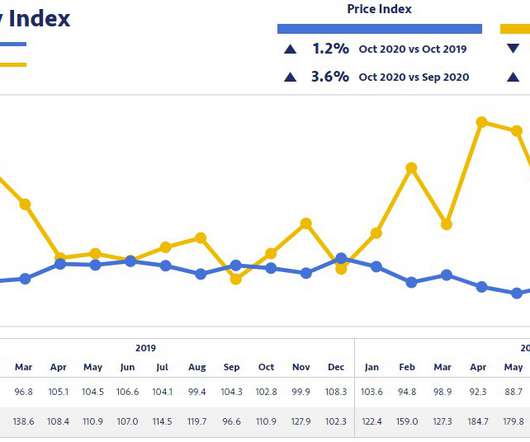
A new European survey has revealed that road transport demand is picking up, according to TMS supplier Transporeon. Compared to October 2019, less capacity was available (-20.3%). • compared to October 2019. • The online service is provided by Tim Consult on the basis of transport data of more than 1.8
Transporeon has presented the results of European Road Carrier survey: Findings point up an urgent need for digital investment amidst pandemic gloom. While nearly 70% of carriers reported business growth for 2019, less than a third expect a positive development in 2020. Carriers make increasingly use of spot market transports.
According to one survey , only 27% of leaders believe that they have the talent needed to meet current supply chain performance requirements. We need problem solvers, people that can work with data from a data analytics perspective. What should supply chain leaders be looking for to close the talent gap?
Jason’s Law Truck Parking Survey and Assessment was developed and implemented to identify driver safety problems and avoid further tragedy. These reports included a 15% hike in miles traveled between 2012 and 2017 in addition to locations that were identified as problematic in a separate survey from 2014. During this briefing, U.S.
Now in its ninth year, E2open’s 2019 Forecasting and Inventory Benchmark Study is the most consistent, comprehensive and useful study of its kind. What’s more, the data from this study doesn’t come from surveys and questionnaires, it is sourced from real data from E2open’s diverse customer base.
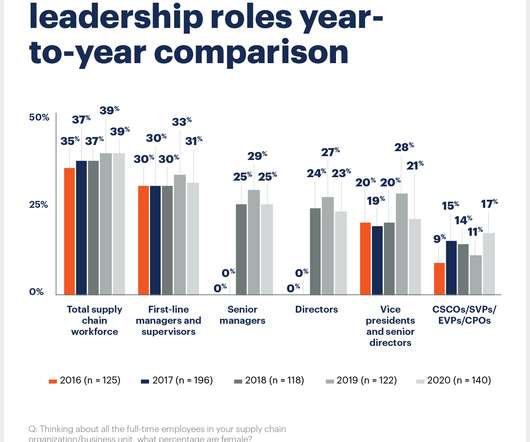
s 2020 Women in Supply Chain Survey among 177 supply chain professionals, 17% of chief supply chain officers (CSCOs) are now women – a 6% increase compared to 2019 and the highest rate since the first edition of the survey in 2016. AWESOME partnered with Gartner to develop the survey and recruit participants. Methodology.
Prior to the pandemic, supply chains were already growing in complexity due to increased globalization, data sources, and customer demands. Gartner, 2019 Digital Talent Gap Survey. Gartner, Supply Chain Brief: U.S.
While creating a demand-driven supply chain means ingesting and interpreting large volumes of data, advances in cloud computing and edge computing make data-based decision making easy and cost-effective. And Agility Can Help Improve Profitability Too? blockchain), and video-based collaboration/content sharing. A Positive Example.
Digital Transformation In Logistics Market – “Global Digital Transformation In Logistics Market Professional Survey Report 2019” presents the latest industry data and future trends, allowing you… The post Digital Transformation In Logistics Market – Recent Industry Developments and Growth Strategies Adopted by Top Players Worldwide 2019-2024 (..)
In 2019, China accounted for 28.7 According to the Associated Chinese Chambers of Commerce and Industry of Malaysia’s (ACCCIM) business survey report conducted by PWC Malaysia, 48 percent of businesses said improving digital capabilities was a business priority over the next three years. Top leadership support for Industry 4.0.
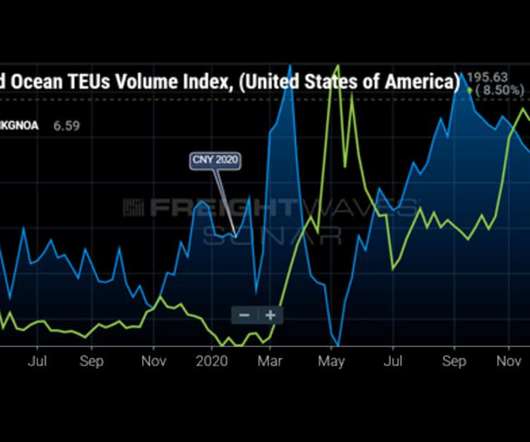
Certainly, there has been some stabilization based on the data released by Descartes Datamyne. up compared to October 2019, before the pandemic took root. The data relied on for these projections and retrospective comparisons is garnered through customs filings. But, as it happened, October did not live down to those fears.
In response to growing demands, experts consider cloud logistics as an optmization tool for the transportation supply chain industry in 2019. As with any new internet based technology, uncertainties include ‘unclear development costs and data security unclear development costs and data security unclear development costs and data security’.
Mitigating your risk comes down to using technology to make better decisions faster by using better data. You must use a network of data to measure yourself against the current market and your peers. Technology allows shipment data like tracking and more to your customer in real-time using methods like APIs or geofencing.
As a result, ARC Advisory Group and DC Velocity magazine have chosen to focus this year’s survey-based research on the changes logistics operations have experienced in the upheaval of the Covid-19 operating environment in 2020; and the expectations logistics executives have about their operating environment in 2021.
In part two of Artificial Intellignece, Morai Logistics discusses the current impact of AI in the supply chain industry in 2019. To understand the global impact of AI, Microsoft commissioned a survey that included 400 senior executives working within eight various markets. Artificial Intelligence at a Glance.
What about the domestic trucking market and its history around rate hikes The domestic trucking market learned this lesson in 2019 as carriers took huge rate increases and invested in fleet expansion, which led to an oversupplied market and multi-year highs for trucking bankruptcies.
European pallet and packaging manufacturers are repairing more wooden pallets for reuse than ever, according to a survey by European Federation of Wooden Pallet & Packaging Manufacturers (FEFPEB). million pallets were repaired in 2019, an increase of 25% on the previous survey carried out three years earlier.
This global survey analyzes the extent to which companies connect the physical and digital worlds to drive innovation through real-time guidance, data-powered environments and collaborative mobile workflows. The post More Firms on an ‘Intelligent’ Path, says Survey appeared first on Logistics Business® Magazine.
The Port of Los Angeles moved near-record cargo in 2019 with a total of 9,337,632 TEUs, just short of the second-best year in their 113-year history despite the ongoing trade war between USA and China. The Center will serve as a neighborhood “cyber-watch” system to protect data flowing through the port community.
During times of high produce activity, the USDA surveys produce shippers in the areas they deem agricultural hubs. Rate data is available for Van (TSTOPVRPM), Reefer (TSTOPRRPM) and Flatbed (TSTOPFRPM) modes. . You can view data in weekly, bi-weekly, monthly and annual changes. SONAR USDA Produce Truckload Spot Rates (AGRATE).
Some businesses reported a positive impact from weather, and the bureau can’t isolate the monthly data at specific geographic levels, it said. Estimates for overall retail sales in the Bloomberg survey ranged from gains of 0.3% Estimates for overall retail sales in the Bloomberg survey ranged from gains of 0.3%
We organize all of the trending information in your field so you don't have to. Join 84,000+ users and stay up to date on the latest articles your peers are reading.
You know about us, now we want to get to know you!
Let's personalize your content
Let's get even more personalized
We recognize your account from another site in our network, please click 'Send Email' below to continue with verifying your account and setting a password.


Let's personalize your content