This site uses cookies to improve your experience. To help us insure we adhere to various privacy regulations, please select your country/region of residence. If you do not select a country, we will assume you are from the United States. Select your Cookie Settings or view our Privacy Policy and Terms of Use.
Cookie Settings
Cookies and similar technologies are used on this website for proper function of the website, for tracking performance analytics and for marketing purposes. We and some of our third-party providers may use cookie data for various purposes. Please review the cookie settings below and choose your preference.
Used for the proper function of the website
Used for monitoring website traffic and interactions
Cookie Settings
Cookies and similar technologies are used on this website for proper function of the website, for tracking performance analytics and for marketing purposes. We and some of our third-party providers may use cookie data for various purposes. Please review the cookie settings below and choose your preference.
Strictly Necessary: Used for the proper function of the website
Performance/Analytics: Used for monitoring website traffic and interactions
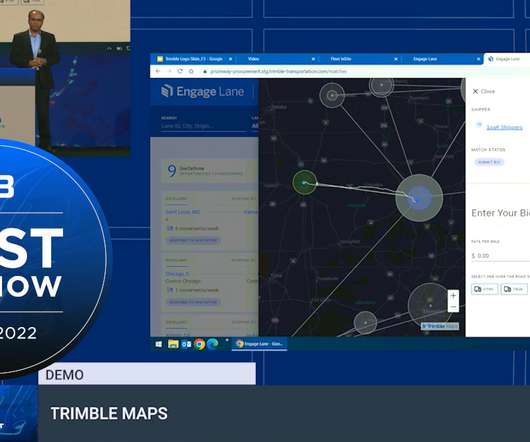
Earlier this month, we took our new Engage Lane solution on the road to FreightWaves’ 2022 Future of Freight Festival (F3) in Chattanooga, Tennessee. We’re proud to announce that the F3 audience voted our demo “ Best in Show ” as one of the most innovative, exciting and powerful products on the market!
It is a challenge for many shippers and carriers to know where they should put their focus and where the data directs them to go. According to FleetOwner , “ trucking companies must go where the data leads them, not where they think it is going to lead them. Why outdated data hurts carriers in the short- and long-term.
In fact, our data shows that accepted tender volume is up 12% y/y. Domestic intermodal contract rates are poised to take another meaningful step up in 2022 on top of double-digit rate increases in 2021. SONAR intermodal contract rate data shows rates up 19% from this time last year. Request a SONAR Demo.
As we approach the end of the year, shippers are in the unenviable position of having to put freight out for bid in a carriers’ market while budgeting for further-inflationary 2022 transportation costs on top of rampant inflation in virtually all of their other costs (labor, materials, packaging, energy, etc.) Request a SONAR Demo.
More Resources Home November 15, 2023 Update The Freightos Weekly Update helps you stay on top of the latest developments in international freight by giving you the rundown on the latest economic data, ocean and air demand trends, rate data – and anything else impacting the market. Freightos Air Index data shows China – N.
Original article: PODCAST: Modern Courier Delivery Compliance Considerations: Understanding SOX and SOC Compliance Logistics and supply chain are some of the world’s most complex and regulated industries, which has been further compounded by increasing reliance on data and technology in both fields. What Is SOC Compliance?
Another peak season in which intermodal demand exceeds supply would likely presage further contract rate increases in 2022. Goods for the holiday shopping season are largely already stateside, which has led to a decline in our forward-looking ocean bookings data. Request a SONAR Demo. Request a SONAR SCI Demo.
More Resources Home June 18, 2024 Update The Freightos Weekly Update helps you stay on top of the latest developments in international freight by giving you the rundown on the latest economic data, ocean and air demand trends, rate data – and anything else impacting the market. kg China – N. Europe – N. China – N.
Earnings season is here and the general theme across truckload carriers is carrying higher rate momentum into 2022. Ultimately, understanding the general market conditions shows whether carriers are right to have an optimistic outlook on pricing in 2022. Request a SONAR Demo. Request a SONAR SCI Demo.
More Resources Home May 28, 2024 Update The Freightos Weekly Update helps you stay on top of the latest developments in international freight by giving you the rundown on the latest economic data, ocean and air demand trends, rate data – and anything else impacting the market. China – N. Europe – N. million TEU twice.
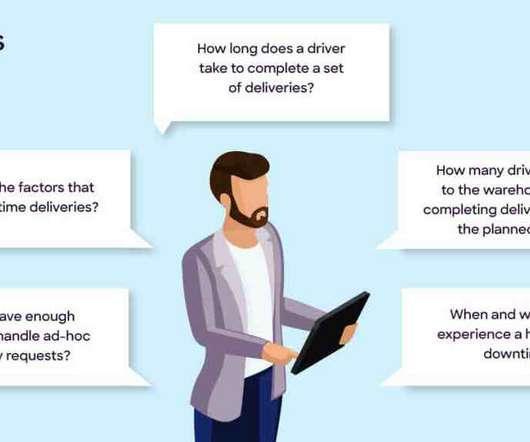
Visibility and data insights can provide you a rock-bottom foundation to accurately plan optimal detention times. Use data for smarter allocation of tasks. This detailed understanding of delivery agents isn’t possible without the help of data. Try a demo with Locus! Schedule Demo.
More Resources Home June 25, 2024 Update The Freightos Weekly Update helps you stay on top of the latest developments in international freight by giving you the rundown on the latest economic data, ocean and air demand trends, rate data – and anything else impacting the market. kg China – N. Europe – N.
CTA Get access to real-time freight pricing and transit time changes with Freightos Terminal Button: View Data Now Link: app.terminal.freightos.com Eytan Buchman CMO, Freightos Group Eytan Buchman loves freight so much he shouts out container sizes while he walks around. and bakes really good cookies.
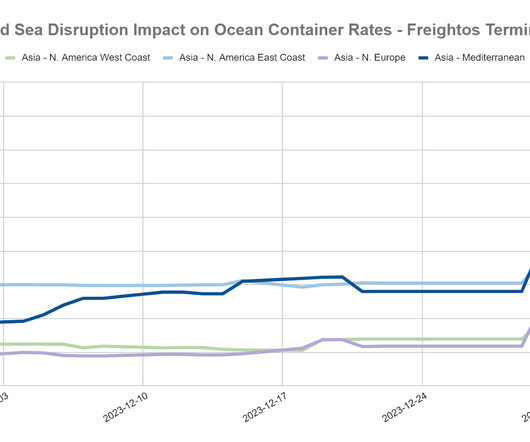
More Resources Home Red Sea and Suez Canal Shipping Crisis Update Judah Levine Optimize your logistics tendering, vendor selection, negotiations, and procurement with Freightos Data Book a Demo Even with an international naval force in place, Houthi attacks on commercial vessels in the Red Sea continue. Europe prices decreased.
Supply Chain Dive reported, “Annual installations of industrial robots will jump from 450,000 a year in 2015 to 600,000 in 2022.” As companies begin incorporating baseline RPA technologies, such as OCR, many are getting stuck by the limitations of some without seeing the advantages of using automation for more data-driven processing. .
The COVID-19 crisis unveiled major issues within global supply chains and, as we have seen with SONAR freight data, volatility in the market. For those that make the right applications of freight data, the massive problems created by the pandemic could have been more easily mitigated.
Transport Topics reported, “While we had been projecting spot rates to increase 4% year-over-year in 2022, our lead economist has adjusted his forecast to 6% growth.” Shipping document automation uses robotics processing automation (RPA) to extract data and appropriately sync it with an internal business system.
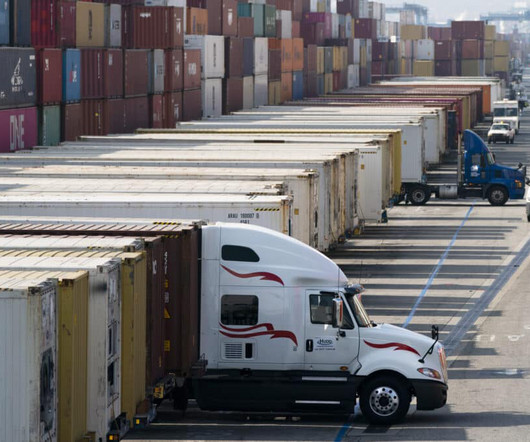
In every mode of transportation, 2022 has revealed a rate trend that continues to increase. Logistics Management released an article on the topic, sharing that, “Matching capacity to need is going to be the key concern for shippers in 2022—almost regardless of price.”
As 2022 reveals a professional world that is more aware of the benefits of remote access to work, more supply chain professionals are choosing to invest in cloud-based technology and automation. Are there data extraction limitations? Are there data extraction limitations? Evaluate System Vendor Features.
Effectively receiving and sending data relies on a whole workflow of automation. A complete workflow minimizes the opportunity for data to get stuck in multiple locations along the way. Seamless Data Sharing With Network Partners. Detailed Reporting Capabilities. An Easy-to-Use Interface to Manage Exceptions.
Key trends in 3PL operations The key trends in 2022 for 3PL operations strive to automate processes and give better insight into customer and shipper expectations, dominated by technology and supply chain data analytics. Request a Turvo Demo. . Today, e-commerce accounts for a record 36.1% growth over February 2020.
Get Your F ree Custom Data Report Learn how customized freight data visibility could align with your unique business needs. Judah Levine Head of Research, Freightos Group Judah is an experienced market research manager, using data-driven analytics to deliver market-based insights. Get Your Custom Report Now!
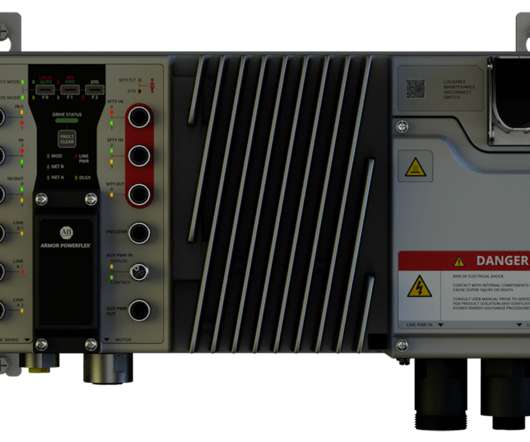
the world’s largest company dedicated to industrial automation and digital transformation, is doubling down on its commitment to the warehouse and fulfilment industry by exhibiting for the first time at MODEX 2022, in Atlanta, on March 28th-31st. Includes an AR workforce demo. Rockwell Automation, Inc. ,
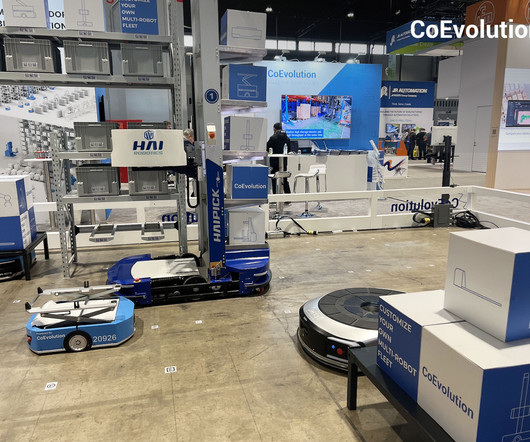
Global demand for mobile robots is anticipated to undergo rapid growth over the coming years, with shipments expected to increase by around 50% between 2022 and 2027. And the outlook is even better for the US multi-fleet orchestration market, with a predicted CAGR of 147% over 2022-2027. What is AMR orchestration?
If you’re tired of relying on spreadsheets, screens upon screens of data, and your ‘gut’ to make the important decisions that will take your intermodal and drayage business to the next level, the Envase BI business intelligence solution may be your answer. Request a Demo. See delivery status with no extra work from your driver.
WRITTEN BY CELINE CLAYTON / POSTED ON MAY 19, 2022. Automated systems and real-time data analytics allow for better management of delivery options overall. Contact OneRail for a demo and learn more about maximizing last-mile delivery in retail today. At the same time, most companies are not at this level just yet.
The American customer satisfaction index customer experience benchmarks for timeliness of delivery fell drastically from 82 in 2020 to 76 in 2022. consumer shipping companies: Customer experience 2017-2022. – Consumer experience with consumer shipping companies in the United States from 2017 to 2022, Statista, 2022.
As part of the Georgetown University McDonough School of Business Global Business Experience Programme, Sitma was invited to submit a project proposal to be implemented with the support and guidance of a team of students from the 2022 Flex MBA class.
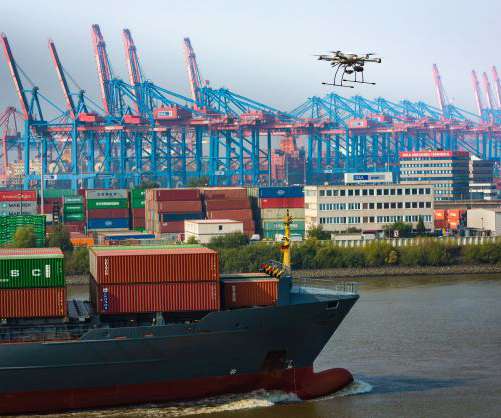
structured and repeatable data collection), to delivery (e.g. The ability of Casia G to detect non-cooperative air traffic and provide essential data to the HHLA Sky system, gives us the opportunity to add yet another crucial level of safety. Interested parties may CLICK HERE to register for an invitation to this demo event.
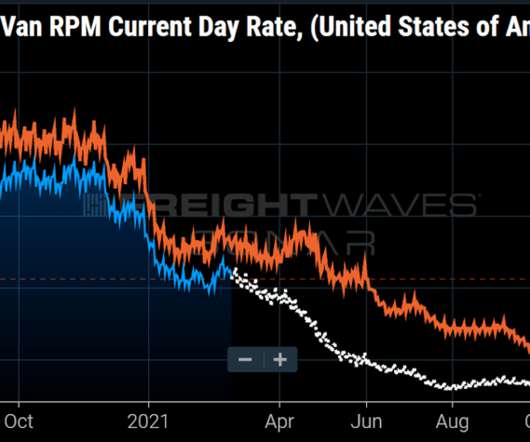
Chart of the Week: Inbound Ocean TEUs Index – USA SONAR : VOTRI.URSE, VOTRI.URNE, VOTRI.URSW, VOTRI.URWT, VOTRI.URMW Southeastern dry van regional rejection rates — the rate at which truckload carriers turn down loads from contracted shippers — have surged past all other regions this summer, hitting their highest level since July 2022.
The algorithm ingests millions of data points, including but not limited to tender data, operational costs, and demographic information and projects them 28 days into the future. . The weighted average calculation weights each lane’s value based on volume derived from tender data. excluding lanes under 250 miles in length).
In 2022 alone, product returns surged to an astonishing $816 billion. Dive into the insights from our latest webinar Returns: More Than Just Refunds In 2022, every sixth item bought online was returned, leading not only to lost sales but also to environmental concerns. Schedule a Demo with Locus today!
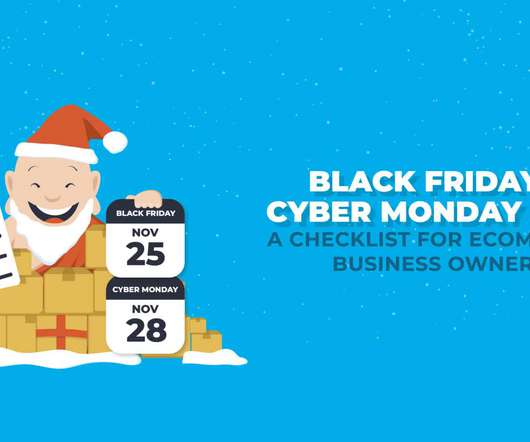
increase from 2022. year over year, but that is a steep slowdown from Black Friday 2022 when YoY sales showed 12% growth over Black Friday 2021. We also hope you’re paying close attention to the data coming in because this will become your baseline for many BFCM seasons to come. Black Friday online sales reached a record $9.8
This backdrop presented a bright outlook for carriers during the first two months of 2022. Interested in staying on top of the freshest freight market data? The SONAR data platform offers the fastest and deepest set of freight market data on the planet. Request a SONAR Demo. Request a SONAR SCI Demo.
Research shows that the online pharmacy revenue in Egypt is around $914 million in 2022 and will reach $1.86 Schedule Demo. The e-pharma market is one of the fastest growing industries globally and this growth is reflective in Egypt and the Middle East as well. billion in 2027. Similarly, revenue in the UAE is about $112.70
In fact, according to a recent report by Mordor Intelligence, the Indian D2C market size was estimated to be at $55 billion in 2022. during the 2022-2027 period, the total addressable D2C market in India is forecast to hit $100 billion by 2025. These sentiments reflect in the consistent growth of theIndian D2C market.
triillion in 2022 to $1.6 Enter the era of AI-driven logistics solutions , far removed from the traditional, clunky methods of managing supply chains on Excel sheets, replete with manual data entry and limited routing capabilities. Descartes allows businesses to consolidate and manage supply chain data.
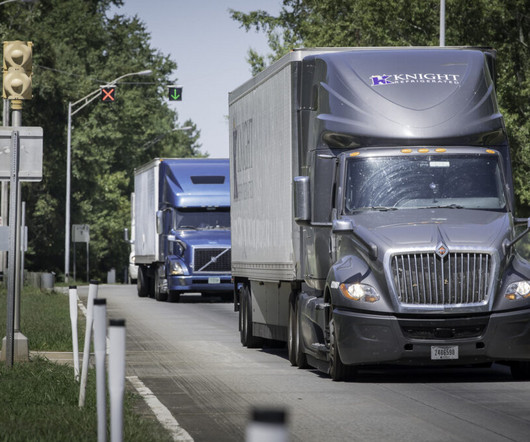
The bad news is that the data suggests demand had dropped well below what carriers needed to maintain their operations with the available equipment. FMCSA data suggests aggregate capacity was still being added to the market through most of 2022. Sign up for a SONAR demo. appeared first on SONAR.
According to a study 1 , there were 268 million digital buyers in the United States in 2022, which was projected to increase to almost 285 million in 2025. Locus provides real-time post-delivery data to leverage as insights so that you can build a foolproof shift plan to accommodate orders and deliver on time. Why choose Locus?
from 2022 to 2030. It provides objective data and operational visibility of transport activities, the former of which can be used to optimize daily operations and reduce carbon footprint. Book a demo with us! Schedule Demo. The global green technology and sustainability market is expected to see tremendous growth— 417.35
While ecommerce has experienced boom after boom, 2022 has proven to be an interesting year in its already storied history. 2 Analyze Your Past Data and Compare It to Current Trends. Being aware of these vital data points will help you consistently improve your strategy year-over-year. Part 2: Tips for Peak Season 2022.
Without data and insights, creating strategies to enhance SCM is like groping in the dark. Amidst a sea of carriers, picking one that matches the right SLA, cost, and other parameters can be a daunting task given the overwhelming amount of data to consider. You can learn more about how Locus supported Avian Brands in our webinar.
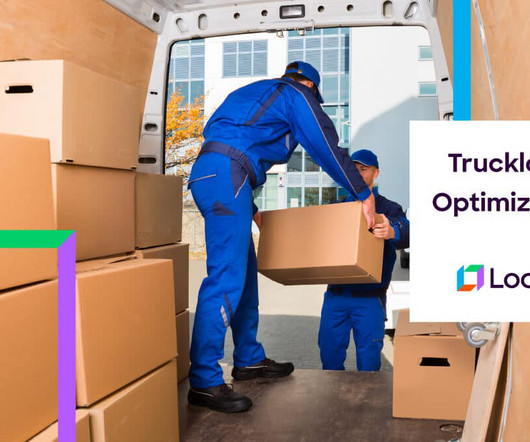
The global trucking industry market size has suppressed $285 billion in 2022 and is said to reach $430 billion by 2032. Route Management Advanced analytics solution: Harness the power of AI to track and analyze your shipping data. Retailers should find ways to optimize truckloads to reap benefits. Tech is not just for Tesla, folks.
At times however, these judgments can be misleading because opinions that are not backed with data, and biases can play in for various reasons. These real-time execution data help them identify the inefficiencies in the dispatching process and eliminate them. Every data collected has an insight, story, and opportunity hidden in it.
We organize all of the trending information in your field so you don't have to. Join 84,000+ users and stay up to date on the latest articles your peers are reading.
You know about us, now we want to get to know you!
Let's personalize your content
Let's get even more personalized
We recognize your account from another site in our network, please click 'Send Email' below to continue with verifying your account and setting a password.


Let's personalize your content