This site uses cookies to improve your experience. To help us insure we adhere to various privacy regulations, please select your country/region of residence. If you do not select a country, we will assume you are from the United States. Select your Cookie Settings or view our Privacy Policy and Terms of Use.
Cookie Settings
Cookies and similar technologies are used on this website for proper function of the website, for tracking performance analytics and for marketing purposes. We and some of our third-party providers may use cookie data for various purposes. Please review the cookie settings below and choose your preference.
Used for the proper function of the website
Used for monitoring website traffic and interactions
Cookie Settings
Cookies and similar technologies are used on this website for proper function of the website, for tracking performance analytics and for marketing purposes. We and some of our third-party providers may use cookie data for various purposes. Please review the cookie settings below and choose your preference.
Strictly Necessary: Used for the proper function of the website
Performance/Analytics: Used for monitoring website traffic and interactions
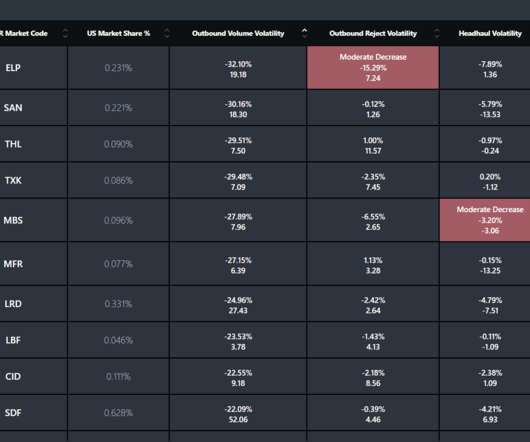
For companies that want to go beyond the traditional spreadsheet, which cannot handle this ocean of information efficiently, statistical methods such as cluster analysis can help. What is Cluster Analysis? Cluster analysis is a statistical umbrella term for methods that classify data points according to their attributes.
From a financial standpoint, transportation cost analysis remains focused on determining the value of the resources used to execute a given shipment and goes well beyond benchmarking. Moreover, this kind of analysis does not focus on who ends up paying which expenses in the end. The challenges of limited transportation cost analysis.
Data access and analysis continue to be essential to competitive operations within the process of monitoring rates and expenses in intermodal shipping lanes. Because availability and demand can impact freight rates and expenses, knowing the current volume trends can help shippers better plan for rates and fees. Request a SONAR Demo.
What is ABC Analysis? ABC inventory analysis is a method used to classify a business’s stock items into three categories – A, B and C, based on their value to the business. In this blog post we’ll delve deeper into the intricacies of ABC analysis and how it can help businesses improve their inventory management practices.
We have made it to the end of the "Most Popular Blog Posts of 2015.So We've already featured all the other popular blog posts from logistics , manufacturing , supply chain , and freight over this week. The most popular blogs are centered around Infographics, reports, facts, and trends.as Top Transportation Blog Posts from 2014.
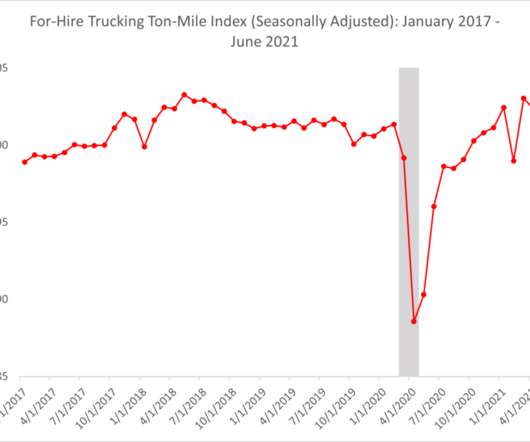
The answer is not simple and involves research and analysis across a number of factors. As a researcher at Michigan State’s Broad College of Business, I will explain how I arrived at this figure, based on available data. Analysis of employment data. for Q2 2021, relative to Q2 2018.
Blog " * " indicates required fields Email * Name This field is for validation purposes and should be left unchanged. America weekly prices increased 2% to $1.85/kg. Some observers anticipate that the strike will still lead to some capacity and equipment shortages at Asian origins in early November.
Driver availability in the delivery, transportation and logistics sectors has become a critical issue with widespread ramifications for businesses and consumers alike. Current State of Driver Availability Statistics The trucking industry, which is pivotal to the economy, is grappling with an unprecedented shortage of drivers.
If youve followed our blog over the years, youll know that weve shared lots of information about distribution network design, why its vital to get it right, how long it should take, the importance of reviewing the network every so often, and various elements of design such as determining the number of warehouses and where to locate them.
Automated Slotting — Systems integrations enable ShipMonk to automatically assign each SKU an optimal storage location within our warehouses, based on the item’s size, expected order volume, and warehouse technologies available. Digital technology reduces the need for frequent physical audits. Contact ShipMonk today.
Stock Availability – A Common Inventory Management Challenge. In this three-part blog series we’re looking at three of the most common inventory management issues faced by stock holding companies. Inventory Management Challenge 3: Improving Stock Availability Without Carrying Excess Stock.
Pulling data takes time and then you must format it for analysis and check for errors. Analysis is limited. this causes delays that reduce the time available for analysis. Easily produce period-on-period analysis reports (e.g., It is slow. Stale data. You will need to go back to the data source and start again.
Unfortunately, without proper processing and analysis, this data is of little use to the organization. By implementing business intelligence (BI) solutions, manufacturers can gather and analyze this data, making it immediately available to decision-makers who can use it to make informed decisions and take prompt action.
Ian Arroyo April 29, 2025 Blog As Freightos’ Chief Strategy Officer, I’ve had the privilege of witnessing firsthand how the logistics industry has transformed since COVID-19 disrupted supply chains worldwide. This ensures that visibility isn’t siloed but available organization-wide.
In this blog, I will explore the use of AI/ML inventory planning for fresh products to optimize sales while minimizing waste and stockouts. For instance, if category managers want to aim for 100% availability of tart cherry juice, they can set the target service level accordingly and allow AI to optimize inventory levels.
When you finally have the analysis, everything’s changed, and the results are no longer relevant. Watch our webinar on demand to find out how you can overcome these issues with our scenario analysis and optimization tool. . You have tough decisions to make about your supply chain network design.
Inventory Management KPIs for Effective Inventory Analysis. But with a wealth of inventory KPIs available to choose from to include in your inventory analysis methods, which ones are the most important to ensure you’re on the right track to optimum efficiency? Managing inventory is a complex business.
On this blog and the one published by our sister company Logistics Bureau, we often receive questions relating to metrics suitable for monitoring procurement performance. In procurement, cost analysis is not just about the price of your company’s purchases. Vendor Availability. 7 Procurement KPIs You Should be Using.
By analyzing the set of vehicles available, the human resources, and the processes required for each delivery, it becomes easier to increase efficiency, agility, savings, and safety. A lower volume of incidents means that vehicles are available for operation for longer.
Modern supply chains are evolving beyond anyone’s expectations due to increased use of cloud-computing technologies, wearables and advanced data analysis. Wearables Became More Cost-Effective and Available. Data Analysis Grew Exponentially, Providing More End-to-End Visibility and Continuous Improvement.
Blog " * " indicates required fields Email * Email This field is for validation purposes and should be left unchanged. Fifteen years ago, DSV’s homepage had this to say about tech: “DSV is committed to providing our customers with the best e-service tools available in order to create visible, transparent and high-quality services.”
Blog " * " indicates required fields Email * More Resources Home August 23, 2023 Update The Freightos Weekly Update helps you stay on top of the latest developments in international freight by giving you the rundown on the latest economic data, ocean and air demand trends, rate data – and anything else impacting the market.
ESG reporting and analysis Data is one of the most important requirements of an ESG program. It is only with the analysis of data that situations can be visualized and changes made. This analysis can help the company develop goals and measurable targets for improving ESG performance. appeared first on SYSPRO Blog.
Blog " * " indicates required fields Email * Phone This field is for validation purposes and should be left unchanged. Capacity shifts to Red Sea lanes and the transpacific – where rates are extremely elevated and attractive to carriers – are also impacting vessel availability to the Middle East. Europe – N.
Editor's Note: This is a guest blog from our friend Greg Braun from C3 Solutions. In this blog, Greg discusses the real cost of inaction when you dont adopt new supply chain technology. Chances are there is a better solution available. And do the cost-benefit analysis. BDC blog, https://www.bdc.ca/en/blog/pages/technology_opportunity_not_be_missed.aspx.
In our previous blog, we explored how matrices enhance supply chain efficiency, from inventory management to logistics. The Future of Matrix-Based Optimization The Future of Matrix-Based Optimization AI and machine learning (ML) take matrix-based analysis to new heights. Now, were taking it a step further.
If you’d like to learn more, download a complimentary copy of Gartner’s “Improve S&OP Decision Making Through Scenario Planning” (it’s available for a limited time, courtesy of AIMMS). The post Leveraging Scenario Planning for S&OP Decision Support appeared first on AIMMS SC Blog.
Therefore, companies should have a system to collect and consolidate the data for reporting and analysis. The advantage of an ERP system is that all this information is available to anyone with the appropriate access authority. This can be used in costing analysis and equipment profitability.
That information is readily available, but with BI, you can dig down into the numbers and easily slice the figures in different ways. The BI tool needs to be able to easily pull all this data together for analysis. Here’s an example. For instance, it’s common for an organization to have key data stored in many disconnected silos.
Enterprise shippers are looking for ways to capture and analyze more data Making the most of available technology has always been critical for fine-tuning a supply chain. Now more than ever, shippers need to find innovative ways to make the most of real-time freight data and analysis.
Blog Topics. Stable Spend Line – When sourcing globally, it is a good practice for companies always to keep “safety stock” available at all times. Despite all the benefits, however, a near-sourcing strategy should not be adopted without a close analysis of your supply chain. 4 Benefits of Near-Sourcing.
There are hundreds of inventory control blog posts on how to organize warehouses, track goods and pick and pack efficiently. It’s the art of achieving stock availability , while reducing inventory costs and minimizing the risk of excess items. Read our blog on demand forecasting accuracy for more details.
Blog " * " indicates required fields Email * Email This field is for validation purposes and should be left unchanged. And though there are still reports of tight space and equipment at Asian export hubs, congestion remains minimal, and there are signs space and equipment availability may already be improving.
This blog post will explore what telematics is, why it’s crucial for last-mile delivery and the vital role it plays when combined with route optimization platforms. The data collected over time allows for trend analysis, enabling continuous route optimization for improved efficiency. That’s where telematics comes in.
It is getting harder to track every item in the inventory and to get relevant analysis out of it. Using AI in demand planning allows an organization to optimize product availability by decreasing stock-outs and spoilage. The post How AI is transforming manufacturing Part 2: Inventory management appeared first on SYSPRO Blog.
In this blog, I will discuss the use of AI/ML demand planning for fresh products to help maximize sales and reduce waste. Real-Time What-If Planning with AI Using what-if analysis to evaluate different scenarios by incorporating internal and external events is a key way to utilize AI/ML in demand planning.
Blog " * " indicates required fields Email * Phone This field is for validation purposes and should be left unchanged. America weekly prices increased 2% to $1.84/kg.
This blog discusses how manufacturers can start making AI a reality. ML and DL are mainly used in data analysis, classification, clustering, and ranking. This helps manufacturers optimize production planning, reduce inventory carrying costs, and improve customer satisfaction by ensuring product availability. How does AI work?
Many manufacturing companies still rely on Excel for all sorts of tasks including scheduling, inventory management and data analysis. The data is stored in a database managed within the building or in the cloud for processing and analysis. Collecting data for effective usage with business intelligence.
The primary challenge to integrating blockchain with existing systems is the limited pool of blockchain applications available on the market. Ongoing analysis of operations and refinement of processes allows for better use and application of blockchain technologies. Expertise and a Strong Understanding of Blockchain are Key.
Blog " * " indicates required fields Email * Phone This field is for validation purposes and should be left unchanged. Europe – N. America weekly prices fell 2% to $1.63/kg. Concern over a possible East Coast and Gulf port labor strike in October is also playing a role.
This blog post delves into the intricacies of logistics in small and medium-sized enterprises (SMEs) and startups, highlighting their unique challenges and opportunities. Supply chain management in small and medium enterprises: A systematic review and bibliometric analysis. International Journal of Production Economics, 242, 108235.
Management has to make sure that machines are always available to maximize capacity. And scheduling must be precise and optimized — you want to use every available minute to ensure that machines are never sitting idle. Margins are thin, so efficiency is an absolute necessity. Inventory is another huge headache.
Fewer labor resources are available to meet the rising demand in both the warehouse and in transit. Port backlogs, cargo limitations on container ships, and a lack of available equipment and port facility staffing. Limited available real estate has further led to challenges as construction came to a halt in the past year.
We organize all of the trending information in your field so you don't have to. Join 84,000+ users and stay up to date on the latest articles your peers are reading.
You know about us, now we want to get to know you!
Let's personalize your content
Let's get even more personalized
We recognize your account from another site in our network, please click 'Send Email' below to continue with verifying your account and setting a password.


Let's personalize your content