This site uses cookies to improve your experience. To help us insure we adhere to various privacy regulations, please select your country/region of residence. If you do not select a country, we will assume you are from the United States. Select your Cookie Settings or view our Privacy Policy and Terms of Use.
Cookie Settings
Cookies and similar technologies are used on this website for proper function of the website, for tracking performance analytics and for marketing purposes. We and some of our third-party providers may use cookie data for various purposes. Please review the cookie settings below and choose your preference.
Used for the proper function of the website
Used for monitoring website traffic and interactions
Cookie Settings
Cookies and similar technologies are used on this website for proper function of the website, for tracking performance analytics and for marketing purposes. We and some of our third-party providers may use cookie data for various purposes. Please review the cookie settings below and choose your preference.
Strictly Necessary: Used for the proper function of the website
Performance/Analytics: Used for monitoring website traffic and interactions
Analytics for Risk Management This isn't your grandmother's dataanalysis; we're talking about sophisticated pattern recognition that makes your shipping operation smoother than a freshly waxed surfboard. And how do you pick the right carrier if you are now receiving new data of damaged packages?
If your systems are disjointed and you lack the ability to analyze masses of data in real time, you will struggle to deliver on-time, in-full and your reputation and revenue will be negatively impacted. This blog is Part 1 in our Optimizing Supply Chain Performance with Unified Data series, with a focus on optimizing fulfillment.
To do that, you need to access accurate data and create insightful reports for GL, as well as other finance and operational needs. The challenge is that many teams also rely on manual data exports from their ERP or ‘data dumping’ into Excel to report on and analyze their data beyond what standard reports offer.
Blog " * " indicates required fields Email * Name This field is for validation purposes and should be left unchanged. Freightos Air index data shows Middle East – N. Europe prices (FBX11 Weekly) fell 3% to $3,523/FEU. Asia-Mediterranean prices (FBX13 Weekly) fell 5% to $3,927/FEU. Europe weekly prices were level at $3.81/kg.
quintillion bytes of data every day. For companies that want to go beyond the traditional spreadsheet, which cannot handle this ocean of information efficiently, statistical methods such as cluster analysis can help. What is Cluster Analysis? The retail industry is rich with data. On average, we humans generate 2.5
From a financial standpoint, transportation cost analysis remains focused on determining the value of the resources used to execute a given shipment and goes well beyond benchmarking. Moreover, this kind of analysis does not focus on who ends up paying which expenses in the end. The challenges of limited transportation cost analysis.
The manufacturing industry is currently undergoing a rapid digital transformation, and as a result, companies are generating vast amounts of data. Unfortunately, without proper processing and analysis, this data is of little use to the organization. This enables managers to take swift action and keep production on track.
April 23, 2025 Blog Today, we’re excited to announce the launch of Freightos Enterprise our comprehensive solution designed specifically for large enterprises that import and export, who need to bring control, visibility, and efficiency to their global logistics operations.
The answer is not simple and involves research and analysis across a number of factors. Robinson’s own technology and data from the largest network in the freight industry, help our customers stay on top of the trends that influence their supply chains. Analysis of employment data. for Q2 2021, relative to Q2 2018.
What is Machine Learning ML is the computing engine behind AI and gives computers the ability to make sense of, and learn, from data to perform specific tasks without manual interference. Nine areas where AI can help manufacturers There are several ways in which data and AI can be applied in the manufacturing industry. The Industry 4.0
Have you conducted a cost-to-serve (CTS) analysis for your enterprise? And that is the sole purpose of cost-to-serve analysis. If you were going to say, “What is a cost-to-serve analysis?” Only a complete cost-to-serve analysis will expose these underlying issues unless they happen to be discovered incidentally.
If youve followed our blog over the years, youll know that weve shared lots of information about distribution network design, why its vital to get it right, how long it should take, the importance of reviewing the network every so often, and various elements of design such as determining the number of warehouses and where to locate them.
Fortunately, smart data utilization can help reduce deadheading occurrences and make the entire supply chain more profitable. Where a supply chain is weak, analysis and advisory teams can fill in the gaps – seeing the correlations between data points and real-time load operations and profits highlights potential problem areas.
Data for data’s sake lacks value, especially in the view of the supply chain. And across the market, submitted data becomes rapidly outdated. And in some industries, outdated data can have disastrous consequences. For instance, take the value added by more accurate data in the health industry.
Ian Arroyo April 29, 2025 Blog As Freightos’ Chief Strategy Officer, I’ve had the privilege of witnessing firsthand how the logistics industry has transformed since COVID-19 disrupted supply chains worldwide. At Freightos, we’ve invested heavily in providing near real-time or real-time data to our customers.
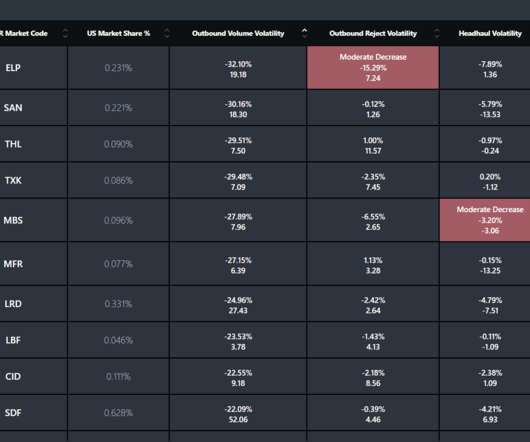
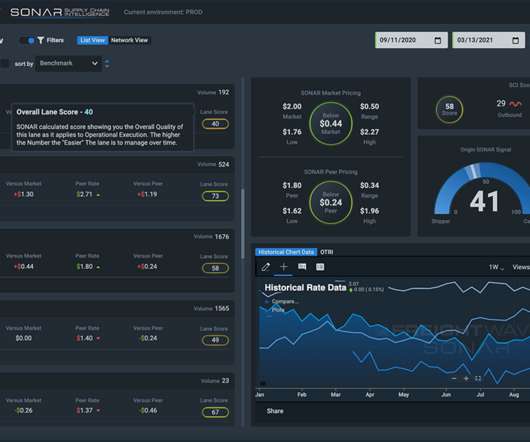
The FreightWaves SONAR Supply Chain Intelligence (SCI) platform now features emissions calculations that are compliant with the GLEC Framework, deepening its carbon intelligence data. SONAR SCI also has rate benchmarking and network analysis capabilities, making it a one-stop shop for measuring trucking network effectiveness.
Reaching mutually beneficial service level agreements (SLA) or trade agreements depends on the access and utilization of current logistics data and a decent amount of preparation. Far too often, there is a severe lack of real-time logistics data to work with during this process. Download the White Paper.
Tracking market trends within truckload rates relies heavily on data and analysis. The key to avoiding this kind of situation is predictive planning and analysis. This kind of real-time dataanalysis and application is essential for shippers to stay strategic and tactical as they forecast out contract and spot truckload rates.
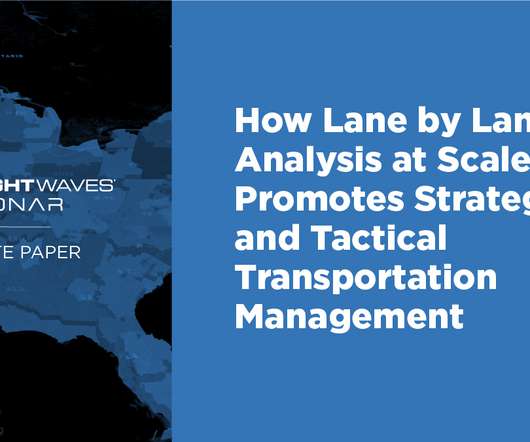
To help shippers understand the value of data-driven bidding in the short- and long-term, powered by Lane Acuity, this white paper will explore: Common problems in managing annual RFP processes for enterprise shippers. How contract data amounts to tactical bidding management. Fill out the Form Below to Access a COPY of the White Paper.
Data represents an integral part of daily life for most people, and it is no different within the transportation industry. That insight into how freight logistics and optimization rely on data and understanding the full picture is critical to making the best improvements in supply chain route optimization too.
AI systems get better and more accurate as they collect and analyze more data. ML is a form of AI that enables a system to learn from data rather than through explicit programming. ML is a form of AI that enables a system to learn from data rather than through explicit programming.
Data access and analysis continue to be essential to competitive operations within the process of monitoring rates and expenses in intermodal shipping lanes. Data access to see savings compared to truckload and other shipping methods. Data accuracy can and does impact freight transportation in a significant way.
Global trade data and shipping demand management are not just things that high-tech companies and international investors need to worry about. This focus makes proper use of global trade data and analytics so vital for continued recovery and growth throughout the supply chain network. Streamline data collection and analysis.
Single Source of Truth — When inventory is coming and going from all directions, order and inventory data is synced to a central platform for easy monitoring and analysis. Data Collection — When human interaction is necessary, CS reps have easy access to customer data, resulting in faster resolutions.
As discussed in the previous blog post, the demand planning process, whose success depends on effective collaboration between teams from various departments, was negatively affected by the pandemic. Granular consumer data To remain competitive, organisations needed to get closer to the market by collecting consumer data on a granular level.
As further explained by Deloitte , “business cases show how new technologies – from smart sensors to advanced data analytics to cognitive computing – are transforming traditional linear supply chains into connected, intelligent, scalable, and customizable digital supply networks to help reduce costs and drive sustainable growth.”
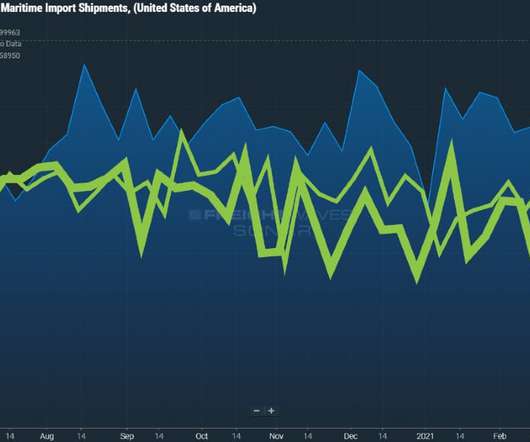
H aving access to real-time freight data and being able to make good use of it is essential for global trade and maritime shipping. Global retailers use data to understand lead time Successful supply chain operation at any stage hangs on the ability to stay on top of shipping and transport logistics. Request a SONAR Demo.
Blog " * " indicates required fields Email * Name This field is for validation purposes and should be left unchanged. Dive deeper into freight data that matters Stay in the know in the now with instant freight data reporting Sign up for Free Analysis Hurricane Milton battered the west coast of Florida last week.
Much has been made in recent weeks about supply chain data providers changing historical metrics. Well, maybe you should, since it’s the title of the blog…DATA INTEGRITY MATTERS! SONAR isn’t yet the longest-running or most-used data source in the trucking world (but we’re getting there!).
Data-driven transportation management , including the checks and reviews that accompany healthy data management practices, are part of the process of getting the most out of the tech stack. This remains key to the overall success of investments within supply chain analysis. Things will go wrong. Think about it.
It is a challenge for many shippers and carriers to know where they should put their focus and where the data directs them to go. According to FleetOwner , “ trucking companies must go where the data leads them, not where they think it is going to lead them. Why outdated data hurts carriers in the short- and long-term.
And that’s why it’s important for carriers to apply data and enable predictive freight rating through these five requirements. Recognize that not all loads are as lucrative as meets the eye, letting data do the talking Benchmarking may be the first step, but the next focuses on identifying the less-lucrative loads.
ERP systems essentially integrate all the disparate functions within your business and overcome the so-called ‘silo mentality’ by creating a single, centralized data architecture. The ERP software collects, stores and manages data relating to business activities. What’s Your Business IQ?
In our previous blog, we explored how matrices enhance supply chain efficiency, from inventory management to logistics. By leveraging these technologies, businesses can optimize operations, reduce costs, and make smarter, data-driven decisions. Now, were taking it a step further. In case you missed it! Read More In case you missed it!
Order-level Management: The tracking of orders from inception to fulfillment, and the management of the people, processes and data connected to the order as it moves through its lifecycle. For companies involved in shipping freight, the combination of order-level management and cost to serve analysis can be a game-changer.
When you finally have the analysis, everything’s changed, and the results are no longer relevant. Poor data quality: 53% of respondents in a Supply Chain Insights survey cited this as a top challenge. . Not all tools are equally data- hungry and some are easier to use than others.
Reporting requires businesses to collect and track data on their ESG performance and report this information in a transparent and consistent manner. This involves implementing processes and systems for collecting and reporting on data, and some businesses may need to ensure that the information is verified by a third party.
Blog " * " indicates required fields Email * Email This field is for validation purposes and should be left unchanged. A recent analysis suggests that some spending growth is on the types of goods , like video games, that don’t ship by ocean container – another factor in the relative disconnect between spending and freight.
Blog " * " indicates required fields Email * More Resources Home August 29, 2023 Update The Freightos Weekly Update helps you stay on top of the latest developments in international freight by giving you the rundown on the latest economic data, ocean and air demand trends, rate data – and anything else impacting the market.
Blog " * " indicates required fields Email * More Resources Home September 6, 2023 Update The Freightos Weekly Update helps you stay on top of the latest developments in international freight by giving you the rundown on the latest economic data, ocean and air demand trends, rate data – and anything else impacting the market.
Blog " * " indicates required fields Email * Phone This field is for validation purposes and should be left unchanged. Subscribe Now Judah Levine Head of Research, Freightos Group Judah is an experienced market research manager, using data-driven analytics to deliver market-based insights. Europe – N.
Blog " * " indicates required fields Email * Email This field is for validation purposes and should be left unchanged. I can’t export maritime incident data from the US Coast Guard (which could use some tech) but based on this report there were 18 bridge allisions in the United States between 1960 and 2015.
Manufacturers rely on data and their ERP platform to answer critical questions: What are our inventory levels? After all, data is the foundation of digital transformation, and according to McKinsey the pandemic caused companies to accelerate their digital transformation plans by three to four years.
Globally, the use of data is growing — and in the past two years, the pandemic has been the main driver behind worldwide data growth, including increased internet access and a new way of working. Ultimately what should matter most for business is not the volume of data but, rather, knowing how to use it.
We organize all of the trending information in your field so you don't have to. Join 84,000+ users and stay up to date on the latest articles your peers are reading.
You know about us, now we want to get to know you!
Let's personalize your content
Let's get even more personalized
We recognize your account from another site in our network, please click 'Send Email' below to continue with verifying your account and setting a password.


Let's personalize your content