This site uses cookies to improve your experience. To help us insure we adhere to various privacy regulations, please select your country/region of residence. If you do not select a country, we will assume you are from the United States. Select your Cookie Settings or view our Privacy Policy and Terms of Use.
Cookie Settings
Cookies and similar technologies are used on this website for proper function of the website, for tracking performance analytics and for marketing purposes. We and some of our third-party providers may use cookie data for various purposes. Please review the cookie settings below and choose your preference.
Used for the proper function of the website
Used for monitoring website traffic and interactions
Cookie Settings
Cookies and similar technologies are used on this website for proper function of the website, for tracking performance analytics and for marketing purposes. We and some of our third-party providers may use cookie data for various purposes. Please review the cookie settings below and choose your preference.
Strictly Necessary: Used for the proper function of the website
Performance/Analytics: Used for monitoring website traffic and interactions
If youve followed our blog over the years, youll know that weve shared lots of information about distribution network design, why its vital to get it right, how long it should take, the importance of reviewing the network every so often, and various elements of design such as determining the number of warehouses and where to locate them.
A freight spend analysis can help cut those extra costs. Performing a freight spend analysis reveals extra costs deriving from unforeseen issues. Let’s look at a few best practices and steps to conduct a comprehensive, insightful cost analysis. Know the scope and value of a freight spend analysis.
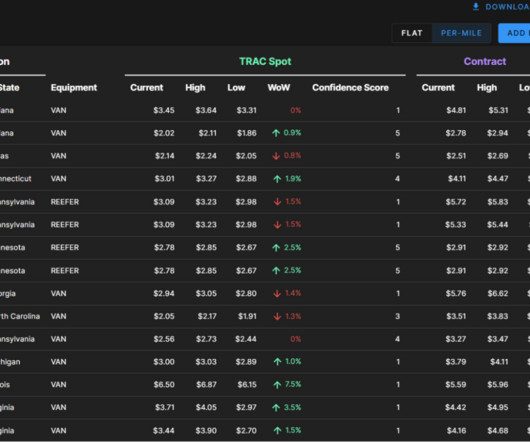
In this article, you learn what are the various reefer freight data indices available in SONAR, who in the freight market relies on these indices, what the indices tell freight market participants, and real-world scenario analysis of using SONAR refrigerated shipping indices to better understand the freight market.
Data access and analysis continue to be essential to competitive operations within the process of monitoring rates and expenses in intermodal shipping lanes. Identifying current inbound and outbound rail volume rates in the current market. Predicted inbound and outbound fuel and maintenance budgeting needs.
Managed transportation is about streamlining and centralizing the whole process of both inbound and outbound logistics, ranging from warehousing through delivery. These processes are intrinsically linked and require shared data and collaboration across all network partners.
Logistics management focuses on two functions: inbound (internal operations) and outbound (flow from the point of origin to consumption). You can rest assured that each of these shipping companies uses the best methods and latest technology to deal with warehousing, inventory, distribution, transportation, and data analysis.
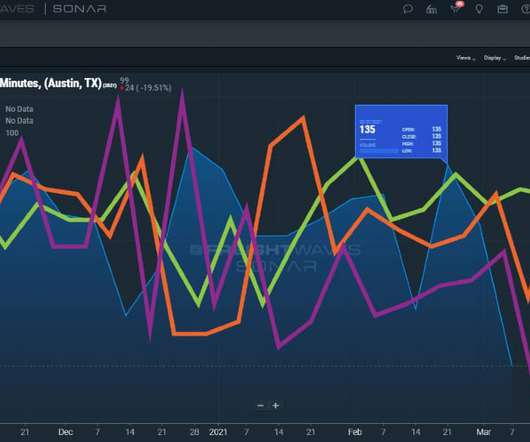
In the screenshot above, you can see that the outbound and inbound stability show scores of 29 out of 100 and 21 out of 100, respectively. harder to procure capacity at the benchmark rate per mile ) in both the outbound and inbound directions. Carriers will be able to see inbound and outbound stability on specific lanes.
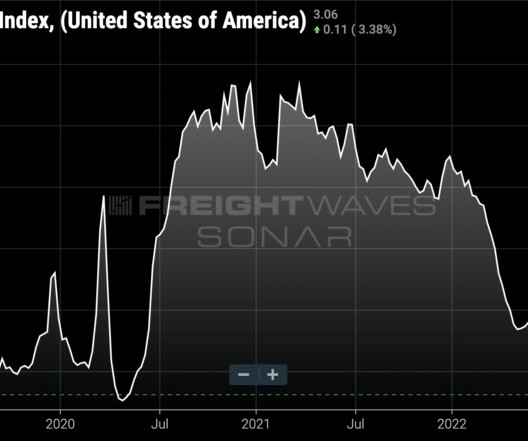
For instance, using the trends and seasonality within the Outbound Tender Rejection Index, shown above , logistics coordinators can create responses to RFPs based on like a higher all-in rate. As highlighted by LinkedIn , a staggering 80% of bargaining is preparation, analysis, data review and planning before any meeting or discussion occurs.
When the HAUL value for a market is positive, that means more outbound freight is being tendered out of that market than inbound freight being tendered into that market. When the opposite happens and the value for HAUL is negative in a market, there is more inbound freight than outbound freight.
Use weekly, monthly, and year-on-year data for your analysis. While the KPI explanations in this post are very brief, you’ll find a wealth of more detailed information here on the Logistics Bureau blog, as well as on that of our supply chain benchmarking and KPI consulting division, Benchmarking Success. Need More KPI Knowledge?
Predictive data analysis allows managers to tweak and adjust route optimization and shipping protocols to accommodate market demands. The value of strategic planning and real-time data analysis cannot be overstated. Trends come and go, needs wax and wane, and the one thing that stays the same is the reality that everything changes.
Another methodology is the Porter’s Value Chain Framework, which comprises of inbound logistics, operations, outbound logistics, sales, and service. They are part of the quality management process and require an analysis of the top factors that drive returns to determine where interventions are required in the process. Outbound KPIs.
Brokers are able to view current spot and contract rates, variability in the rates, Lane Scores and Outbound Tender Rejections for the origin, which improves their network optimization on the loads they are currently running. Not a SONAR customer? Get in touch with one of our experts here.
When the HAUL value for a market is positive, that means more outbound freight is being tendered out of that market than inbound freight being tendered into that market. When the opposite happens and the value for HAUL is negative in a market, there is more inbound freight than outbound freight.
This includes both outbound and inbound freight. Many times, the shipper goes to their IT department to get the data they need to run an analysis to find out how compliant they are or to look for strategies to lower their spend. Every company has logistics problems. Stale, Incomplete Data Is a Problem in Problem Solving.
Part of that strategy lies in using the right transportation data, analysis and insightful reports, such as those provided within FreightWaves SONAR, to guide day-to-day operations. Outbound/Inbound Tender Rejection Indices to understand market trends and rates. Download the White Paper.
If you’ve followed our blog over the years, you’ll know that we’ve shared lots of information about distribution network design, why it’s vital to get it right, how long it should take, the importance of reviewing the network every so often, and various elements of design such as determining the number of warehouses and where to locate them.
As you’ll know, if you follow our blog regularly, Logistics Bureau does a great deal of work related to supply chain strategy development and alignment. Another thing we talk about quite often on our blog is how companies often misjudge the needs and preferences of their customers. Step 1: What do Your Customers Want?
Market intelligence + analysis: carrier pricing, for example, can change at any moment. A typical carrier sales rep’s metrics are: 60 outbound calls per day and 10 loads booked each day (spot freight).
And lane-by-lane insights are critical to account for that disruption among raw material suppliers and the flow of outbound freight. Insight into market stability promotes increased transportation procurement and intervention when necessary Insight into the manufacturing supply chain market depends on lane-level analysis and response.
We expand upon the supply chain technology trends we spoke about in the first part of this blog series, but let’s take a look at 5 more supply chain tech trends that will shape 2018. WHITE PAPER] The Top Supply Chain Trends that Will Impact Supply Chain Management in 2018.
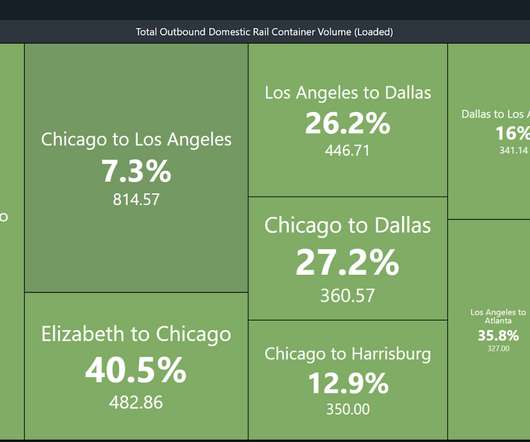
The data used in this analysis comes to FreightWaves from a transaction processor. . We conducted our analysis in this manner to protect the anonymity of the shippers while keeping the real-world complexities that exist in a freight network. . Most dry outbound Chicago shipments already move via rail intermodal. .
Measuring capacity is a key to maximizing margins/transactions for a broker, utilization for a carrier, and minimizing service and budgetary failures for shippers.The capacity trend indices show you which markets are tightening or loosening by the largest amounts by combining tender rejection rates and market balance of inbound and outbound loads.
Improved planning through wait time analysis benefits all parties. That includes compliance with the inbound freight routing guide and outbound activities. For instance, shippers see the warehouse use rates via the LMI. Multi-angled views like distribution center wait times help to avoid surprises. . Things go wrong in supply chains.
Goodwill notes shipment data granularity and analysis are linked with better freight allocation , which means making use of the full spectrum of available shipping options, including full truckloads. Yet, the problem remains: shippers need to be able to fill an entire truckload. Full Truckload White Paper Series. Lower cost of shipping.
“Paralysis by analysis” is a common term used to describe such a situation, and you can avoid it by monitoring a smaller number of carefully chosen KPIs. Use weekly, monthly, and year-on-year data for your analysis. This approach will help to save you from paralysis by analysis. Bringing Suppliers on Board.
Market intelligence + analysis: carrier pricing, for example, can change at any moment. A typical carrier sales rep’s metrics are: 60 outbound calls per day and 10 loads booked each day (spot freight). A Brokerage’s Brand Ambassadors.
With the businesses they collaborate with, they become partners and take full ownership of the management, analysis, and execution of the supply system. Outbound transportation. Despite possible confusion, logistics companies provide more than only services. The operation of distribution centers. Value added services. Stock control.
The Outbound Tender Reject Index measures the percentage of load tenders rejected by carriers. Then come procurement processes, including consuming market research and expert analysis, issuing requests for proposals, evaluating vendors, and negotiating contracts— all before the deal is signed.
By neglecting or underestimating the need for meaningful analysis, they typically fail to attain anything like the value they might receive with effective carrier management. You must evaluate the option in detail to know if it presents more pros than cons or vice versa. If you focus on the former, you will likely achieve the latter.
Your inbound and outbound freight costs should be consistently monitored because of the volatile climate that is surrounding freight supplies in all industries. Every company should understand the variables that most affect this metric and form a benchmark analysis around those variables. YOU MISMANAGE YOUR WORK FORCE.
In a previous blog, we covered the challenges and opportunities that come with taking a wholesale brand DTC. Blogs, newsletters, videos and other forms of online content allow you to bring your products to life, share knowledge and ideas, and set yourself up as a leader in your brand category. Show your product in action?
The Guide to Proactive Inbound, Outbound, and Reverse Enterprise Parcel Management. For more about how a parcel TMS can help you pull all the pieces together and put in place enterprise shipping controls from ordering through returns, see our blog post “Improve Parcel Shipping through Better Planning and Execution”. NEW WHITEPAPER.
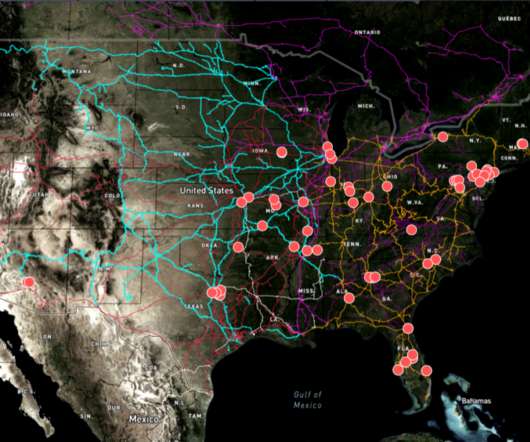
Are containers being transloaded into 53-foot dry vans and trucked from portside markets, or are the rails capturing more market share of outbound surface shipments to the inland markets around the U.S.? market, which has very limited outbound freight. SONAR data can identify tight relationships such as U.S.-bound Retail use case No.
CLX TMS powered by e2open helps chemical shippers to achieve best-in-class operations in every aspect of their transportation network to deliver significant and rapid ROI with benefits such as: Consolidating freight from less-than-truckload to truckload, or for outbound or inbound moves from a distribution center.
The pre-Holloween explosion of a fully loaded outbound container at a Port of Los Angeles terminal was a scary incident for a number of reasons, say shipping analysts. . and destined for an export market may now have an impact on new protocols for outbound inspection and diligence. . By Patrick Burnson, Executive Editor ·. At 5:58 p.m.
In a recent discussion with a potential freight brokerage customer, I discovered their carrier sales metrics: 60 outbound calls per day 10 loads booked each day (spot freight). At 50 carriers, the time involved to run this process for a single Order Tender is about 100 - 250 minutes! On average, each call has to be less than 3 minutes.
As youll know, if you follow our blog regularly, Logistics Bureau does a great deal of work related to supply chain strategy development and alignment. Another thing we talk about quite often on our blog is how companies often misjudge the needs and preferences of their customers. Step 1: What do Your Customers Want?
You can do all kinds of scenario analysis and ‘what-ifs?’ “Real-time data includes social sentiment, unstructured data from social media and blogs, and things like that,” Gaurav explains. He adds that, while some information may be suited to immediate decision-making, other data will need more careful handling. .
Do a transportation analysis. Carefully plan your inbound and outbound transportation. See if the inland ports are well-connected to these transportation modes. For instance, consider how far the port is from the airport or railway. Align your needs with the port's location. Consider how critical timing is for your operations.
hence, this makes analysis of the data and comparisons possible. As a result, accounting does not understand changes in transportation costs, for example, because of changes in the distance inbound and outbound shipments must travel, or in the shipment size or in the mix of commodities being shipped. Or so they say.
We organize all of the trending information in your field so you don't have to. Join 84,000+ users and stay up to date on the latest articles your peers are reading.
You know about us, now we want to get to know you!
Let's personalize your content
Let's get even more personalized
We recognize your account from another site in our network, please click 'Send Email' below to continue with verifying your account and setting a password.


Let's personalize your content