This site uses cookies to improve your experience. To help us insure we adhere to various privacy regulations, please select your country/region of residence. If you do not select a country, we will assume you are from the United States. Select your Cookie Settings or view our Privacy Policy and Terms of Use.
Cookie Settings
Cookies and similar technologies are used on this website for proper function of the website, for tracking performance analytics and for marketing purposes. We and some of our third-party providers may use cookie data for various purposes. Please review the cookie settings below and choose your preference.
Used for the proper function of the website
Used for monitoring website traffic and interactions
Cookie Settings
Cookies and similar technologies are used on this website for proper function of the website, for tracking performance analytics and for marketing purposes. We and some of our third-party providers may use cookie data for various purposes. Please review the cookie settings below and choose your preference.
Strictly Necessary: Used for the proper function of the website
Performance/Analytics: Used for monitoring website traffic and interactions
As the global freight market continues to evolve, so too will the tools that drive it. Together, Freightos and Shipsta are committed to delivering ongoing innovation, including AI-assisted procurement and in-platform analysis that ensure procurement professionals stay ahead in an increasingly complex landscape.
Low-code tools give an easy-to-use support for building software applications, eliminating the need for in-house coding specialists. Therefore, embracing tools that assist organizations create solutions faster like low code should be a consideration to manufacturers. What is low code development? Low code and ERP.
Mid-market manufacturers need a tool that’s tailored to their needs. The BI tool needs to be able to easily pull all this data together for analysis. Bringing in additional outside data sources can make analysis even more powerful by enabling one to look at a question from a more holistic point of view.
What is ABC Analysis? ABC inventory analysis is a method used to classify a business’s stock items into three categories – A, B and C, based on their value to the business. In this blog post we’ll delve deeper into the intricacies of ABC analysis and how it can help businesses improve their inventory management practices.
Have you conducted a cost-to-serve (CTS) analysis for your enterprise? And that is the sole purpose of cost-to-serve analysis. If you were going to say, “What is a cost-to-serve analysis?” Only a complete cost-to-serve analysis will expose these underlying issues unless they happen to be discovered incidentally.
However, freight claims management is important and merits more attention, especially when trend analysis shows factors leading to recurring claims. The post Freight Claims Processing Software: Benefits of Web-Native Tools appeared first on MercuryGate International.
Each of these elements more traditionally handles by outsourcing analysis of processes to supply chain consultant. As explained in a previous blog post, continuous improvement in an organization can be achieved through the use of performance measurement tools via big data. Transportation modes used in procurement and shipping.
If youve followed our blog over the years, youll know that weve shared lots of information about distribution network design, why its vital to get it right, how long it should take, the importance of reviewing the network every so often, and various elements of design such as determining the number of warehouses and where to locate them.
Industrial engineers have used heuristics-based rules, what-if analysis, and physics-based simulation to get predictive and prescriptive insights for several years. AI integrated with tools like ERP can provide more personalized experiences by analyzing user roles, past data interactions and common workflows. Select the right tool.
As discussed in the previous blog post, the demand planning process, whose success depends on effective collaboration between teams from various departments, was negatively affected by the pandemic. Tools such as Zap BI can enable an organisation to process data more efficiently.
Unfortunately, without proper processing and analysis, this data is of little use to the organization. BI is a powerful tool that can help companies drive informed decisions, improve their planning processes, and maintain a competitive edge in the marketplace. This enables managers to take swift action and keep production on track.
When you finally have the analysis, everything’s changed, and the results are no longer relevant. Not all tools are equally data- hungry and some are easier to use than others. Watch our webinar on demand to find out how you can overcome these issues with our scenario analysis and optimization tool. .
Shipping analytics tools shine a light on the value of informed freight management. Freight market participants need these top shipping analytics tools in their freight stack. Shipping status tools to track freight. Tracking shipment status is a core function of advanced shipping analytics tools. Download the White Paper.
Network Design tools that are fueled by powerful mathematical optimization in the back end, and intuitive scenario analysis capabilities at the front, empower you to create flexible plans and expose hidden risks in your network. This leads to insightful and resilient thinking. . – Tweet this.
A freight spend analysis can help cut those extra costs. Performing a freight spend analysis reveals extra costs deriving from unforeseen issues. Let’s look at a few best practices and steps to conduct a comprehensive, insightful cost analysis. Know the scope and value of a freight spend analysis.
In our previous blog, we explored how matrices enhance supply chain efficiency, from inventory management to logistics. The Future of Matrix-Based Optimization The Future of Matrix-Based Optimization AI and machine learning (ML) take matrix-based analysis to new heights. Now, were taking it a step further.
To build and customize reports many teams use Excel, the accountant’s favorite tool. Pulling data takes time and then you must format it for analysis and check for errors. Analysis is limited. this causes delays that reduce the time available for analysis. Easily produce period-on-period analysis reports (e.g.,
Single Source of Truth — When inventory is coming and going from all directions, order and inventory data is synced to a central platform for easy monitoring and analysis. For a Closer Look, Check out These Blog Articles: 3PL Automation: Inside Modern Fulfillment Center Machinery 3PL Automation vs Technology: What’s the Difference?
As data becomes a critical resource in modern organizations, business users are clamoring for tools to ease access to data for reporting and dashboards. Production EA can bring predictive analytics and mobile-friendly tools for manufacturers to ensure high quality, optimized performance and yield, and reduced costs.
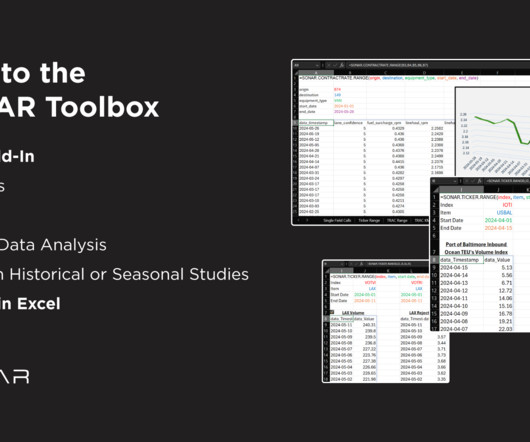
Excel analysis of the new SONAR tool shows how truckload competes with rail intermodal by lane Prior to last month, SONAR data was available in two ways: by using the browser-based visualization tool or via an API connection. The post New Add-in Tool Brings SONAR Data to Excel appeared first on SONAR.
Analytics for Risk Management This isn't your grandmother's data analysis; we're talking about sophisticated pattern recognition that makes your shipping operation smoother than a freshly waxed surfboard. You can read more about how to optimize your carrier selection with Stord Parcel and improve your annual parcel spend in this blog post.
A fleet management system is a fundamental tool in the planning and operational control of the logistics sector. The opportunities for improvement when using this system include: Real-time location tracking of each vehicle; Analysis of drivers’ behavior in relation to what was planned and what happened.
For companies involved in shipping freight, the combination of order-level management and cost to serve analysis can be a game-changer. By combining order-level management with cost to serve analysis, businesses gain unparalleled transparency into their operational costs. The benefits of each component are highlighted below.
If you’re wondering what is the best way to manage inventory with hundreds or even thousands of SKUs, you’ve found your answer: ABC analysis (otherwise known as ABC classification ). In this post, we’re going to discuss how you can classify your inventory into three ABC categories and introduce the concept of XYZ analysis.
Applying the correct Business Intelligence tools to this data for data analysis, trends and forecasts makes the combination invaluable. Today, Business Intelligence is understood as the gathering, storage and analysis of business data. appeared first on SYSPRO Blog. What’s Your Business IQ?
Blog " * " indicates required fields Email * Email This field is for validation purposes and should be left unchanged. Fifteen years ago, DSV’s homepage had this to say about tech: “DSV is committed to providing our customers with the best e-service tools available in order to create visible, transparent and high-quality services.”
Inventory Management KPIs for Effective Inventory Analysis. But with a wealth of inventory KPIs available to choose from to include in your inventory analysis methods, which ones are the most important to ensure you’re on the right track to optimum efficiency? Managing inventory is a complex business. Inventory turnover ratio.
This can result in different teams using different data formats, diverging results from data analysis, and hence poorly aligned decision making. Following a holistic analysis performed by ORTEC experts, this large fabric manufacturer found that the production choices they were making resulted in plant downtime.
The evolution of cargo tracking from traditional methods to sophisticated digital tools marks a significant leap in how logistics companies manage and monitor shipments. This blog will explore how these tools work, their benefits, and their impact on the logistics industry.
Many manufacturing companies still rely on Excel for all sorts of tasks including scheduling, inventory management and data analysis. However, today’s manufacturers need a more robust, effective, connected, and specialised tool to run their businesses.
They Give You Tools That Let You Breathe You shouldnt need five emails, two phone calls, and a spreadsheet to know where your shipment is. At GoShip, we believe in clarity, consistency, and giving you the tools (and support) to ship smarter not harder. But the truth is, freight can either slow you down or help you scale.
They have several capabilities of an ERP system; optimizing cost control, streamlining business processes, improving productivity, and providing real-time data analysis for reporting and decision making. When businesses gain new leadership, they often restructure and implement new strategies and tools.
By using strong management and analysis processes, supply chains can maximize value and stay competitive. And freight KPIs can serve as a valuable tool for freight market intelligence. Streamline data capture and analysis. Freight intelligence tools help management develop a more unified freight strategy.
Relying solely on manual shipping data analysis continues to yield poor results. And that all begins with deploying advanced freight management analytical resources and tools that actively work to lower all risks, ranging from detention through final mile management. New ways must be adopted. Download the White Paper.
7 min read Maximizing Warehouse Efficiency: Unleashing the Potential of ABCD Analysis In the dynamic world of supply chain management, optimizing warehouse operations has become an indispensable factor for businesses. One of the most powerful tools employed in this endeavor is the ABCD Analysis.
Some tools may be acquired by competitors, who then incorporate them in a vastly more expensive package. If you make modifications to the tool, you’re on your own. We wanted to have a robust analysis that we fully understood. But the speed of analysis did not match the speed of decision-making required by the business.
In this blog post, we will explore the highly effective ABCD Analysis technique for warehouse optimization with its pitfalls and how organizations can leverage their data to implement this strategy successfully based on Log-hubs experience over the last years.
In this blog post, we will explore the highly effective ABCD Analysis technique for warehouse optimization with its pitfalls and how organizations can leverage their data to implement this strategy successfully based on Log-hubs experience over the last years.
Blog " * " indicates required fields Email * Comments This field is for validation purposes and should be left unchanged. If a company can specialize in core competencies with AI tools, it creates a high barrier for another company to compete against.
In this four part blog series we discuss how inventory management teams can use inventory optimization to help deal with the impact of the Coronavirus in the medium and long term, focusing on demand forecasting, supplier management and inventory planning. The era of using spreadsheets to run reports and analyze data is over.
Th is blog post covers the critical ways strategic partnerships can help supply chain managers achieve optimal OTR management for their freight. Access to to real-time data and the ability to perform real-time analysis enables businesses to make data-driven decisions to drive efficiency into the supply chain.
Knowing the following key tactics and using the proper tools will help sustain long-term savings. Using FreightWaves SONAR’s DHL Pricing Power Index (DHLPPI.USA) allows for the weekly analysis of pricing power between shippers and carriers based on the conditions of the current freight market. Request a SONAR Demo.
In this blog, I will explore the use of AI/ML inventory planning for fresh products to optimize sales while minimizing waste and stockouts. This analysis identifies the inventory level where profitability is maximized by keeping customers happy while minimizing excess stock.
Here’s how the combination of data with ERP systems is impacting businesses: By employing analytical tools, organizations can begin to use this data to make accurate predictions that form the basis of a more intelligent approach to business strategy. The post Technology innovations shaping the future of ERP appeared first on SYSPRO Blog.
We organize all of the trending information in your field so you don't have to. Join 84,000+ users and stay up to date on the latest articles your peers are reading.
You know about us, now we want to get to know you!
Let's personalize your content
Let's get even more personalized
We recognize your account from another site in our network, please click 'Send Email' below to continue with verifying your account and setting a password.


Let's personalize your content