This site uses cookies to improve your experience. To help us insure we adhere to various privacy regulations, please select your country/region of residence. If you do not select a country, we will assume you are from the United States. Select your Cookie Settings or view our Privacy Policy and Terms of Use.
Cookie Settings
Cookies and similar technologies are used on this website for proper function of the website, for tracking performance analytics and for marketing purposes. We and some of our third-party providers may use cookie data for various purposes. Please review the cookie settings below and choose your preference.
Used for the proper function of the website
Used for monitoring website traffic and interactions
Cookie Settings
Cookies and similar technologies are used on this website for proper function of the website, for tracking performance analytics and for marketing purposes. We and some of our third-party providers may use cookie data for various purposes. Please review the cookie settings below and choose your preference.
Strictly Necessary: Used for the proper function of the website
Performance/Analytics: Used for monitoring website traffic and interactions
Recent research across 50+ procurement professionals found them most concerned with the impact of external factors on operations, with rising costs ( 55% ), geopolitical disruptions ( 45% ) and capacity constraints ( 38% ) at the top concerns. Why Rate Refresh?
From a financial standpoint, transportation cost analysis remains focused on determining the value of the resources used to execute a given shipment and goes well beyond benchmarking. Moreover, this kind of analysis does not focus on who ends up paying which expenses in the end. The challenges of limited transportation cost analysis.
Dive deeper into freight data that matters Stay in the know in the now with instant freight data reporting Sign up for Free Analysis Some minimal congestion – caused by the three day strike at the beginning of the month – remains at US East Coast and Gulf ports though operations have mostly recovered.
In this article, you learn what are the various reefer freight data indices available in SONAR, who in the freight market relies on these indices, what the indices tell freight market participants, and real-world scenario analysis of using SONAR refrigerated shipping indices to better understand the freight market.
Among enterprise companies, one critical aspect of successful negotiation and capacity procurement is a better predictive outlook of both spot and contract truckload rates. Tracking market trends within truckload rates relies heavily on data and analysis. The key to avoiding this kind of situation is predictive planning and analysis.
Shipping managers continue to struggle with capacity procurement during this time of industry-wide disruption . Poor capacity acquisition comes down to poor communication and freight contracts negotiation due to outdated methods. Request a FreightWaves SONAR demo today by clicking the button below to get started.
A freight spend analysis can help cut those extra costs. Performing a freight spend analysis reveals extra costs deriving from unforeseen issues. Let’s look at a few best practices and steps to conduct a comprehensive, insightful cost analysis. Know the scope and value of a freight spend analysis.
Trucking capacity is tight, and deadheading is the precursor of even stricter capacity. Where a supply chain is weak, analysis and advisory teams can fill in the gaps – seeing the correlations between data points and real-time load operations and profits highlights potential problem areas. Think about it.
Now more than ever, shippers need to find innovative ways to make the most of real-time freight data and analysis. Today, logistics strategies rely on accurate and up-to-date data for everything from capacity planning to invoicing. Sometimes data analysis needs to be refocused and fine-tuned. Request a SONAR Demo.
Judah Levine November 15, 2023 Optimize your logistics tendering, vendor selection, negotiations, and procurement with Freightos Data Book a Demo Weekly highlights Ocean rates – Freightos Baltic Index Asia-US West Coast prices (FBX01 Weekly) increased 6% to $1,711/FEU. Asia-US East Coast prices (FBX03 Weekly) climbed 3% to $2,421/FEU.
Dive deeper into freight data that matters Stay in the know in the now with instant freight data reporting Sign up for Free Analysis Hurricane Milton battered the west coast of Florida last week. As long as Red Sea diversions continue to absorb capacity on an industry level, prices may not fall much further than seen back in April.
A great deal of the cost that goes into shipping gets tied up in securing load capacity and budgeting for fees and expenses incurred along the way. Understanding why rate forecasting is so vital and how accurate data and analysis can help improve predictions are essential. Request a FreightWaves SONAR demo now to get started. .
Judah Levine November 28, 2023 Optimize your logistics tendering, vendor selection, negotiations, and procurement with Freightos Data Book a Demo Weekly highlights Ocean rates – Freightos Baltic Index Asia-US West Coast prices (FBX01 Weekly) increased 3% to $1,613/FEU. Asia-US East Coast prices (FBX03 Weekly) fell 1% to $2,362/FEU.
Judah Levine March 12, 2024 Optimize your logistics tendering, vendor selection, negotiations, and procurement with Freightos Data Book a Demo Weekly highlights Ocean rates – Freightos Baltic Index Asia-US West Coast prices (FBX01 Weekly) fell 7% to $4,419/FEU. Asia-US East Coast prices(FBX03 Weekly) fell 8% to $6,107/FEU.
Should these rate increases stick, the common driver supporting them would be the combination of increasing demand with the market’s overall capacity being fully employed due to Red Sea diversions – with Houthi attacks continuing this week – even as the global fleet continues to grow on new vessel deliveries. Europe – N.
Judah Levine Optimize your logistics tendering, vendor selection, negotiations, and procurement Book a Demo Weekly highlights Ocean rates – Freightos Baltic Index Asia-US West Coast prices (FBX01 Weekly) increased 3% to $1,609/FEU. Asia-US East Coast prices (FBX03 Weekly) climbed 7% to $2,357/FEU.
Dive deeper into freight data that matters Stay in the know in the now with instant freight data reporting Sign up for Free Analysis Last week, Canada’s Labor Minister ended the separate labor disputes – one on each coast – that had resulted in lockouts at Canada’s major container ports. America weekly prices increased 9% to $2.60/kg.
Access to data and proper analysis are both essential to maximize profits and reduce costs. There are many ways for shippers to take advantage of technology and advancements within the industry, but three key methods are essential for utilizing trucking data to source capacity. Request a SONAR Demo. trillion in 2018.
Judah Levine December 6, 2023 Optimize your logistics tendering, vendor selection, negotiations, and procurement with Freightos Data Book a Demo Weekly highlights Ocean rates – Freightos Baltic Index Asia-US West Coast prices (FBX01 Weekly) were level at $1,620/FEU. Asia-US East Coast prices (FBX03 Weekly) were also level at $2,367/FEU.
Dive deeper into freight data that matters Stay in the know in the now with instant freight data reporting Sign up for Free Analysis Ocean peak season’s early arrival together with Red Sea diversions straining capacity and schedules continued to result in worsening congestion, equipment shortages and elevated prices this week.
With capacity already tight due to Red Sea diversions, rates last week climbed to $4,151/FEU to N. Europe, this demand increase while capacity is already scarce is pushing transpacific rates up sharply with West Coast prices up 33% from the April floor to $3,873/FEU last week and East Coast rates up 19% compared to April to $5,093/FEU.
Enterprise shippers need a proactive strategy to secure capacity One of the biggest challenges that shippers face remains to secure capacity. Along with this keeping, the fleet loaded to maximum capacity is essential. Improved predictive analysis and projection with logistics automation data and insights.
As highlighted by LinkedIn , a staggering 80% of bargaining is preparation, analysis, data review and planning before any meeting or discussion occurs. Keep extra carriers on hand and keep the availability of drivers open for locating added capacity. Request a SONAR Demo. Request a SONAR SCI Demo.
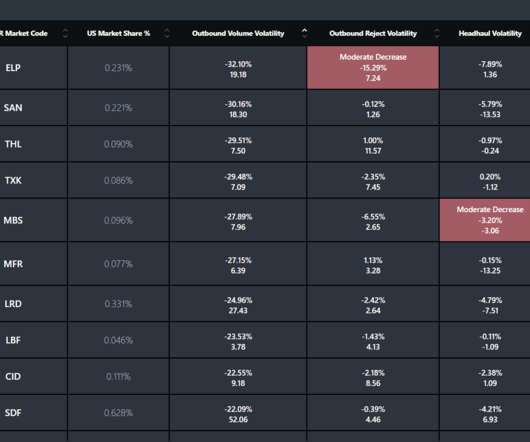
FreightWaves SONAR is releasing new indices – Capacity Trend Market Scores and Capacity Trend Market Direction – to help shippers, carriers and brokers prioritize specific routes daily. Capacity Trend Market Scores Capacity Trend Market Scores are divided into two perspectives – shipper/broker and carrier.
Digital freight matching is growing more valuable as a way to source meaningful capacity Companies and freight managers that have embraced digital technology and automation remain more likely to thrive. Using digital freight matching platforms is the best strategy to secure meaningful and practical capacity. Request a SONAR Demo.
This is seen exceptionally well when looking at rail capacity and transportation rates for the modern supply chain. Data access and analysis continue to be essential to competitive operations within the process of monitoring rates and expenses in intermodal shipping lanes. Request a SONAR Demo.
As a result, transportation fleets must leverage truck utilization data daily as well as load percent capacity, driver wellness and other KPIs to monitor the efficiency and optimization of each unit. As seen with the recent weather turmoil, that can amount to recognizing when freight movements are likely to tighten capacity.
Most observers expect rates to remain well above normal levels while diversions continue, as carriers are facing higher costs and the longer routes soak up capacity. America rates above normal, with carriers reportedly adding capacity for the coming month in anticipation of improving volumes. Still, current rates are around 2.5X
Dive deeper into freight data that matters Stay in the know in the now with instant freight data reporting Sign up for Free Analysis The massive IT outage caused by the CrowdStrike update on Friday led to thousands of delayed or canceled flights worldwide over the weekend as airport and airline systems went black. Europe – N.
Dive deeper into freight data that matters Stay in the know in the now with instant freight data reporting Sign up for Free Analysis Ocean rates out of Asia climbed significantly last week, with the latest daily prices already at $8,200/FEU to N.America West Coast, $9,300/FEU to the East Coast, $8,600/FEU to N.
Dive deeper into freight data that matters Stay in the know in the now with instant freight data reporting Sign up for Free Analysis A massive container explosion on a vessel docked at the Port of Ningbo on Friday – the most destructive of several recent container fires – closed the port’s Phase III Terminal for 60 hours over the weekend.
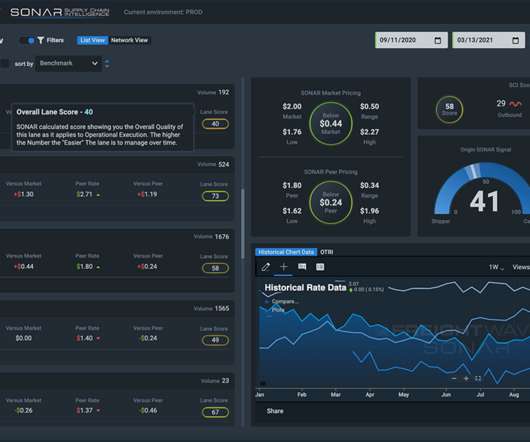
Subscribers receive near-time market intelligence to improve pre-RFP strategy analysis and can identify new market opportunities with little to none native, historical data. And, a user can appropriately allocate internal resources to secure dedicated capacity, based on a Lane Scorecard lane profile. It has been recognized by Inc.,
By using strong management and analysis processes, supply chains can maximize value and stay competitive. Streamline data capture and analysis. Data for the sake of data is meaningless without proper, automated analysis and data capture. Request a FreightWaves SONAR demo by clicking the button below. .
Judah Levine January 16, 2024 Optimize your logistics tendering, vendor selection, negotiations, and procurement with Freightos Data Book a Demo Weekly highlights Ocean rates – Freightos Baltic Index Asia-US West Coast prices (FBX01 Weekly) fell 5% to $2,588/FEU. Asia-US East Coast prices (FBX03 Weekly) climbed 7% to $4,278/FEU.
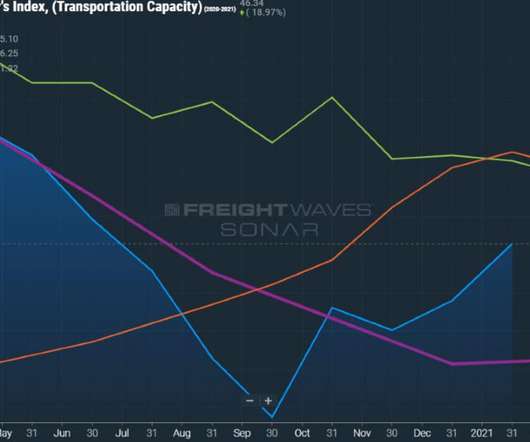
That’s even more true since transportation capacity, indicated by LMI.TPCP, is at 46.34, well below prior years’ averages in the above image. The problem: Shipping demand management includes a need to source capacity around the clock Capacity rules when it comes to keeping the supply chain moving and the trucks full.
National Carriers – These more extensive networks will help management secure capacity on trucks that can travel greater distances. Create the right balance between spot and contract capacity. Truckload service focuses on balance and having available trucking capacity when in high demand. Download the White Paper.
Dive deeper into freight data that matters Stay in the know in the now with instant freight data reporting Sign up for Free Analysis Ocean rates out Asia eased slightly last week across the major lanes. Europe – N. America weekly stayed level at $1.66/kg. For shipments to N.
Dive deeper into freight data that matters Stay in the know in the now with instant freight data reporting Sign up for Free Analysis Typhoon Gaemi wreaked havoc in the form of evacuations and deadly mudslides and flooding across the Philippines and Taiwan on Thursday and parts of southeast China into Friday. Europe – N.
Implementing predictive traffic analysis and real-time GPS tracking can help navigate these issues, allowing for immediate rerouting if needed for an effective delivery schedule. Improved optimal route analysis not only enhances schedules but also boosts customer satisfaction by ensuring timely deliveries. Start Using RouteManager!
Dive deeper into freight data that matters Stay in the know in the now with instant freight data reporting Sign up for Free Analysis Overall, the ocean container market has settled into a new routine that avoids the Red Sea due to Houthi attacks which continued this week. America weekly prices increased 1% to $1.81/kg.
It’s because enterprise shippers are turning to new intelligence tools, such as SONAR SCI , to conduct a freight spend analysis to maximize contract freight use and allocation. And despite the current challenges, carriers are already looking for ways to augment their capacity through increased access to freight broker resources and beyond.
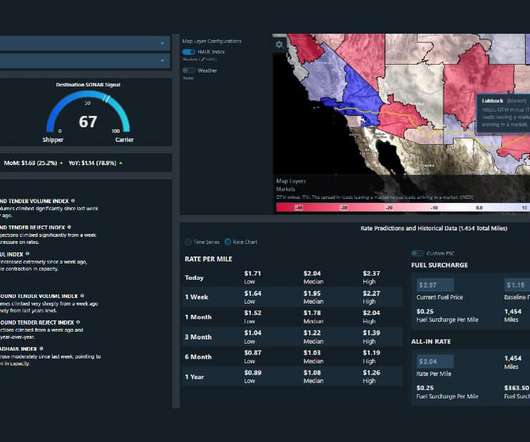
Using FreightWaves SONAR’s DHL Pricing Power Index (DHLPPI.USA) allows for the weekly analysis of pricing power between shippers and carriers based on the conditions of the current freight market. Modern, more effective strategies in today’s freight market have overtaken the old ways of manual shipping data analysis.
Judah Levine December 13, 2023 Optimize your logistics tendering, vendor selection, negotiations, and procurement with Freightos Data Book a Demo Weekly highlights Ocean rates – Freightos Baltic Index Asia-US West Coast prices (FBX01 Weekly) fell 1% to $1,603/FEU. Asia-US East Coast prices (FBX03 Weekly) climbed 5% to $2,497/FEU.
With demand stable in those months carriers had just enough capacity and equipment to keep the market balanced and rates elevated but level. Europe – N. America weekly prices fell 1% to $1.73/kg. If these market conditions persist, rates are likely to climb past their Q1 highs on additional June GRIs and surcharges. million TEU twice.
We organize all of the trending information in your field so you don't have to. Join 84,000+ users and stay up to date on the latest articles your peers are reading.
You know about us, now we want to get to know you!
Let's personalize your content
Let's get even more personalized
We recognize your account from another site in our network, please click 'Send Email' below to continue with verifying your account and setting a password.


Let's personalize your content