This site uses cookies to improve your experience. To help us insure we adhere to various privacy regulations, please select your country/region of residence. If you do not select a country, we will assume you are from the United States. Select your Cookie Settings or view our Privacy Policy and Terms of Use.
Cookie Settings
Cookies and similar technologies are used on this website for proper function of the website, for tracking performance analytics and for marketing purposes. We and some of our third-party providers may use cookie data for various purposes. Please review the cookie settings below and choose your preference.
Used for the proper function of the website
Used for monitoring website traffic and interactions
Cookie Settings
Cookies and similar technologies are used on this website for proper function of the website, for tracking performance analytics and for marketing purposes. We and some of our third-party providers may use cookie data for various purposes. Please review the cookie settings below and choose your preference.
Strictly Necessary: Used for the proper function of the website
Performance/Analytics: Used for monitoring website traffic and interactions
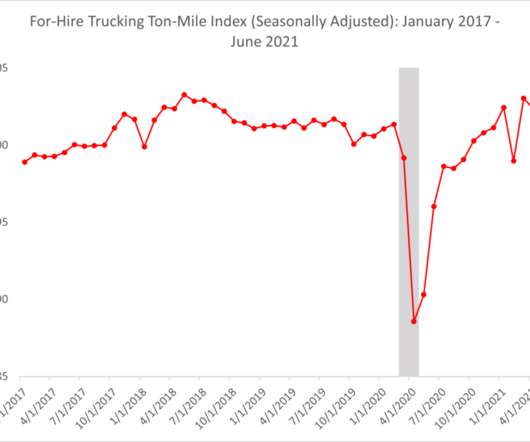
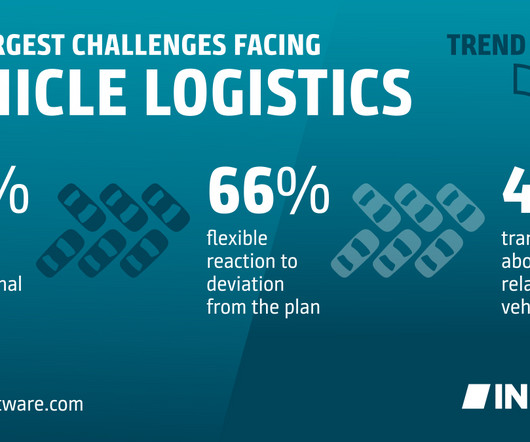
Shippers and carriers alike are currently being challenged by driver shortages and tight capacity. As the largest global collaborative network connecting shippers and carriers, the Transporeon Group periodically surveys its base of more than 3,000 North American carriers to see how market forces are shaping trucking businesses today.
This begs the question: Even if the industry gets more truck drivers, just how much is enough to relieve the strain on trucking capacity? The answer is not simple and involves research and analysis across a number of factors. How many more truck drivers are needed to balance demand for truck transportation with the supply of capacity?
Shippers and carriers alike are currently being challenged by driver shortages and tight capacity. As the largest global collaborative network connecting shippers and carriers, the Transporeon Group periodically surveys its base of more than 3,000 North American carriers to see how market forces are shaping trucking businesses today.
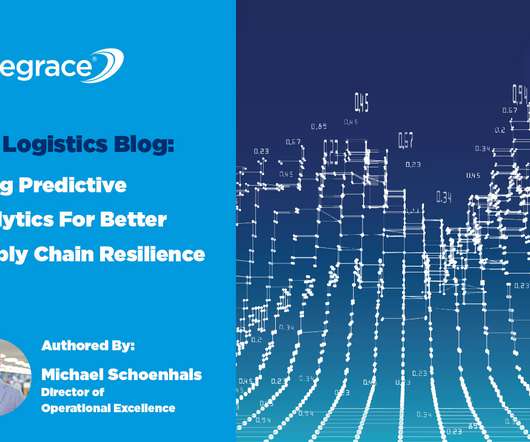
In a survey of 150 global manufacturing executives, 47% committed to improving supply chain visibility and tracking. According to the Global Supply Chain Disruption and Future Strategies Survey Report, this goal was the top-ranked planned tool investment. Agility to act on transparency. Analytics inform decisions.
A recent online survey conducted b y MIT’s Center for Transportation & Logistics aimed to understand how companies are reacting to the Coronavirus outbreak. By dynamically adjusting capacities and utilizations within the app, they were able to optimally reallocate volumes and develop a new production and distribution plan.
Shippers and carriers alike are currently being challenged by driver shortages and tight capacity. As the largest global collaborative network connecting shippers and carriers, the Transporeon Group periodically surveys its base of more than 3,000 North American carriers to see how market forces are shaping trucking businesses today.
Dive deeper into freight data that matters Stay in the know in the now with instant freight data reporting Sign up for Free Analysis Ocean peak season’s early arrival together with Red Sea diversions straining capacity and schedules continued to result in worsening congestion, equipment shortages and elevated prices this week.
With the current warehousing capacity crunch, technology-driven strategies along with flexibility and end-to-end visibility are the preferred solutions for transporters and warehouse operators. What’s covered in this article: Capacity and labor shortages. Tips to overcome warehousing capacity shortages. Download Our Whitepaper.
truck drivers still use paper logs to track hours of service, despite the federal mandate, says a new survey with 2,400 respondents from software-as-a-service (SaaS) company Teletrac Navman that provides GPS fleet tracking. . What Does the ELD Mandate Mean: Transit times, Capacity, and Rates . Analysis with BlueGrace .
Robinson experts provided in-depth analysis of current supply and demand trends, our updated forecast, and the impact of global import volumes on North American freight transportation. How does the port congestion and increased port freight affect national trucking capacity? The capacity migrates to the opportunities.
Drivers are in short supply already, so finding a backup for sick drivers or losing drivers puts private fleets at the risk of losing capacity. Many companies want a private fleet to have easy access to the capacity to haul their freight. You’ll know that you always have capacity available, even when the market is challenging.
With a detailed analysis of current challenges, including capacity constraints and the need for greater operational efficiency and transparency, this report is grounded in insights from 106 industry professionals. Key Findings from the Report 1.
A fair and easy carrier experience is the foundation for creating a competitive brokerage, where quality carriers return and will commit capacity at a fair price. In a recent survey over 200 carriers, ease of working and experience ranked as among the top three determinants when it comes to selecting a logistics partner.
Capacity constraints and transportation delays. Shifting consumer demand, bad weather, driver shortages, fuel prices and an array of influences conspire to shrink available capacity. While supply chains are recovering, a recent survey found that 57% of shippers experienced longer lead times from suppliers in China.
SYSPRO ’s 2020 survey, The Inflection Point for the Factory of the Future , showed that only about one-third (38%) of manufacturers’ business systems had enabled them to meet the challenges posed by the COVID-19 pandemic. Management has to make sure that machines are always available to maximize capacity.
Shippers had to keep products moving when full container load (FCL) capacity and equipment became scarce. Recent market insights found the following: “According to a latest global shipper survey, 75% of shippers who use LCL plan to continue or increase it in 2023.
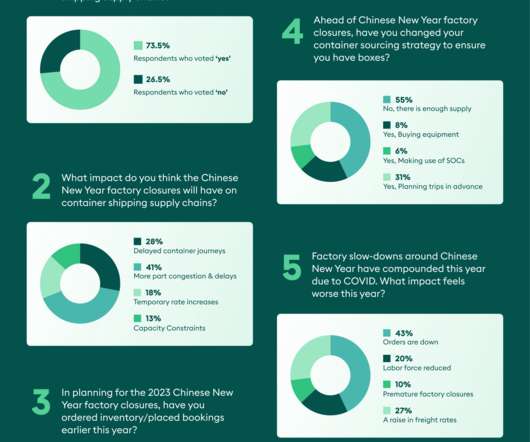
said Cathy Morrow Roberson, Founder and President of Logistics Trends & Insights LLC during a webinar organised by Container xChange on the Chinese New Year analysis and predictions. Last year, most industry professionals feared capacity issues and higher rates as the Chinese New Year aftermath.
Custom fabricators have to cope with highly varying demand cycles from many different steel sales customers, and to do that effectively they need capacity. They’re building that capacity with more equipment. Look for the steel fabrication industry to want to add capacity to gear up for the unexpected.
Data analysis renders greatest of help in taking key decisions which are based on facts and trends. Businesses must have a few solid key performance indicators (KPIs) that act as their short and long term objective and utilize data analysis to align themselves to those goals. The fundamentals of data analysis lie in data.
Before the pandemic, in a study of logistics providers conducted by Fraunhofer IML, among those embarking on digitalization initiatives, only 25% of logistics providers in the Fraunhofer IML survey are leveraging digital technologies to think outside the box and reinvent their foundational delivery model. The Crucial Role of Trading Partners.
The bank said Friday that it is launching new “Supply Availability Indexes” via a blog posting on Monday that going forward will feature as part of its regular monthly surveys of regional business activity. The indexes will feature in future Empire State Manufacturing and Business Leaders surveys, the bank said.
In a recent survey, 32% of online retailers expected logistics and delivery to be their biggest cost this year. Truck Capacity Crunch . The first explanation for the rise in transportation costs is the truck capacity crunch. The first explanation for the rise in transportation costs is the truck capacity crunch.
The LCI surveyed a diverse portfolio of shippers across different verticals, including consumer packaged goods (CPG), industrial and manufacturing and direct-to-consumer business to examine three primary metrics going into the next quarter. This was seen in the survey.
The persistent soft pricing in the shipping sector is expected to extend into 2025, a consequence of capacity outpacing demand. As we turn our attention to Lunar New Year in February 2024, the survey paints a muted outlook. The first half of 2024 might be challenging, but a slightly better outlook in the second half is predicted.
supply chain by taking DOT transportation survey Industry pursues the fight against the California AB5 law Truckload volumes go up while rail shipping volumes decline Leading reasons the supply chain is all jacked up. supply chain by taking DOT transportation survey. The Top 5 Stories in Freight. Help improve the U.S.
A fair and easy carrier experience is the foundation for creating a competitive brokerage, where quality carriers return and will commit capacity at a fair price. In a recent survey over 200 carriers, ease of working and experience ranked as among the top three determinants when it comes to selecting a logistics partner.
51% of the respondents in a global Reuters survey felt that the most perplexing challenge is the unpredictable nature of consumer demand. Approaching a demand analysis with historical data and seasonal variations is no longer competent. Every step of the way can use predictive analysis. Demand forecasting is hard.
Drones can be programmed to survey specific locations regularly, detecting early signs of pest infestations. Examination of Reflectance Spectra The analysis of reflectance spectra is at the forefront of modern pest control methodologies, particularly when integrated with drone technology.
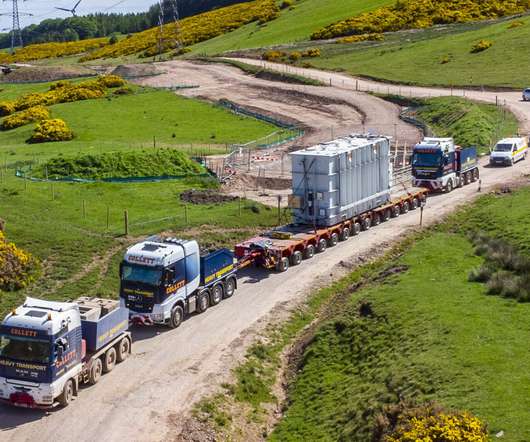
A year before deliveries commenced, Collett’s Consulting Department was contracted to undertake multiple surveys to find the most feasible route. This included all route surveys, swept path analysis reports, topographical surveys, bridge height surveys and wire cable height surveys.
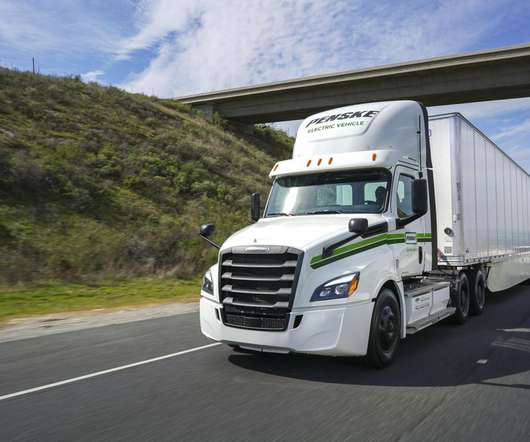
For fleets trying to deploy zero-emission technologies to meet some of these or their own goals, charging infrastructure gaps, consistently high battery and production costs, and power capacity constraints resulted in project delays in 2023, all of which are expected to persist for several years.
Report authors surveyed nearly 250 U.S.-based Among surveyed fleets, 73% report that fuel cost savings is a primary advantage for deploying natural gas units. Production capacity for renewable diesel increased from 600 million to 800 million gallons per year between late 2020 and mid-2021. Renewable diesel growth is very strong.
I want to say a special thank you to Steve Banker and Conrad Hanf who I have worked closely with for the last 10+ years on Logistics Viewpoints as well as countless research projects, surveys, and events. I’d also like to thank Clint Reiser, Mike Guilfoyle, and Andy Chatha. from May’s 2.24 reading.
Then there’s the struggle of finding capacity, managing costs, meeting service requirements, creating a more resilient operation, and more. WITH CAPACITY. Technology can help you create win-win opportunities to match loads to available capacity. Or get more committed capacity and good on-time service at a reasonable cost.
A recent survey of customer service experiences, reports DC Velocity , revealed many retailers feel current technologies do not address their customer service needs, and as few as 3 percent of retailers site full support as part of their current systems. Last Mile Vehicle Capacity Used Versus Available. Fuel Consumption Rates.
A report by Deloitte commented that in a wide-ranging survey of health-related businesses and researchers, 67 percent agreed that data storage and integration will be a key service in the future. An ERP solution can provide the data platform to gather data from multiple sources. Download Now.
Most of the experts surveyed foresee that inflation and recession will have a greater impact this year and will be the biggest driver of disruptions. ‘‘Due Freight forwarders will employ a ‘wait and see’ approach before making any long-term air cargo capacity commitments particularly.” the report claims.
Capacity data— email capacity, user-entered data, and engagement data collected via brokerage-carrier interactions. Second, our engineering, quality assurance, and support teams may, from time to time, view your load and capacity data to maintain, improve, and support our cloud software services. Who Can Access Your Data?
Capacity data— email capacity, user-entered data, and engagement data collected via brokerage-carrier interactions. Second, our engineering, quality assurance, and support teams may, from time to time, view your load and capacity data to maintain, improve, and support our cloud software services. Who Can Access Your Data?
Capacity data— email capacity, user-entered data, and engagement data collected via brokerage-carrier interactions. Second, our engineering, quality assurance, and support teams may, from time to time, view your load and capacity data to maintain, improve, and support our cloud software services. Who Can Access Your Data?
Increasing lead times, costs, and delays resulted in significant problems together with port congestion, capacity availability, and container shortage. An ever-increasing B2C model of e-commerce delivery and spiking imports from China to restock inventories quickly led to a freight capacity shortage. Want A Free Supply Chain Analysis?
Key factors such as shipment ready times, driver availability, lockout times, aircraft capacity, and any specific customer preferences are all evaluated in real-time.” Making sense from the noise: A recent WebCargo survey found that nearly half of all forwarders rely on three or more tech systems.
Often a tool like a Failure Mode and Effect Analysis (FMEA) is useful as it serves as a checklist and ensures that the business is thinking about these issues and considering mitigation plans. Without a thorough analysis of the supply chain and the consumption models, the business may still find itself running out of critical inventory.
A recent online survey conducted b y MIT’s Center for Transportation & Logistics aimed to understand how companies are reacting to the Coronavirus outbreak. By dynamically adjusting capacities and utilizations within the app, they were able to optimally reallocate volumes and develop a new production and distribution plan.
Of 1,200 industry professionals surveyed for the 2021 Agility Emerging Markets Logistics Index, 51.5% The survey is part of the 2021 Agility Emerging Markets Logistics Index, the company’s 12th annual snapshot of industry sentiment and ranking of the world’s 50 leading emerging markets. 2021 Index and Survey Highlights .
We organize all of the trending information in your field so you don't have to. Join 84,000+ users and stay up to date on the latest articles your peers are reading.
You know about us, now we want to get to know you!
Let's personalize your content
Let's get even more personalized
We recognize your account from another site in our network, please click 'Send Email' below to continue with verifying your account and setting a password.


Let's personalize your content