This site uses cookies to improve your experience. To help us insure we adhere to various privacy regulations, please select your country/region of residence. If you do not select a country, we will assume you are from the United States. Select your Cookie Settings or view our Privacy Policy and Terms of Use.
Cookie Settings
Cookies and similar technologies are used on this website for proper function of the website, for tracking performance analytics and for marketing purposes. We and some of our third-party providers may use cookie data for various purposes. Please review the cookie settings below and choose your preference.
Used for the proper function of the website
Used for monitoring website traffic and interactions
Cookie Settings
Cookies and similar technologies are used on this website for proper function of the website, for tracking performance analytics and for marketing purposes. We and some of our third-party providers may use cookie data for various purposes. Please review the cookie settings below and choose your preference.
Strictly Necessary: Used for the proper function of the website
Performance/Analytics: Used for monitoring website traffic and interactions
On this blog and the one published by our sister company Logistics Bureau, we often receive questions relating to metrics suitable for monitoring procurement performance. To answer some of those inquiries, we decided to release the following brief overview of what we believe to be the most helpful procurement KPIs.
Supply Chain big data is the ultimate compilation of data gathered in the course of business. This includes risk analysis, detailed reports of how a supply chain functions, and even lead generation. Big data analytics allows supply chain leaders to identify what portions of the customer journey are threatened.
Have you conducted a cost-to-serve (CTS) analysis for your enterprise? And that is the sole purpose of cost-to-serve analysis. If you were going to say, “What is a cost-to-serve analysis?” When costs begin to spiral out of control, the result is usually a loss of revenue in proportion to sales.
Of course, the big challenge in this type of external benchmarking is obtaining the necessary data, since many companies are wary of sharing performance data with potential competitors. Of course, its also possible to add further tiers for even more granularity, but again, the more levels you have, the more complex your KPI solution.
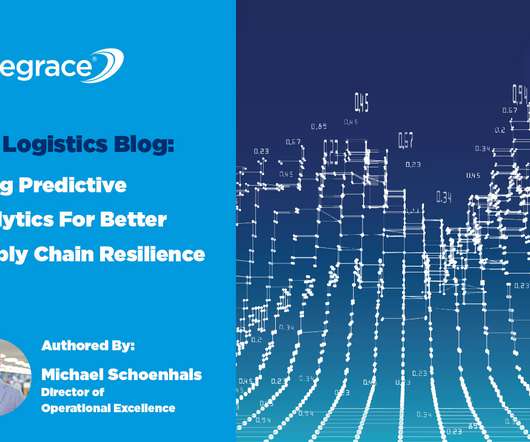
We explore how predictiveanalytics and big data with human sentiments can add value and amplify their supply chain strategies. What this blog is about: Leveraging predictiveanalytics for forecasting and visibility. Having random data is meaningless without insightful analytics. Concept of PredictiveAnalytics.
So, let’s take a look at how our predictions for the first four manufacturing technology trends (Predictiveanalytics, 3D Printing, and VR) to watch for in 2016 stacked up. PredictiveAnalytics Became Commonplace to Manufacturing. Clearly, the IoT has caught on much faster than experts could have hypothesized.
Quality and Detail of Data and its Analysis In some of our earlier posts, weve stressed the importance of simplicity in distribution network design , and we will return to that topic later in this article. It’s not a short list, so we’ll set it down here as a summary to help you with plans for analysis.
The answer is to benchmark your freight, of course. There are several advantages to understanding your freight costs compared to the market generally. Alternatively, you can procure access to a digital freight benchmarking platform. The Pros and Cons of Procuring a Benchmarking Tool.
The fact is, most business owners think of procurement as nothing more than a transactional relationship. Of course, it wouldn’t be a business strategy if there weren’t a couple more acronyms to learn. SRM is more than a one-and-done analysis. Establish KPIs that hold both your suppliers and your procurement team accountable.
Regardless of advances in business analytics therefore, I still advocate a measured approach to measurement (pun intended), by way of a carefully chosen handful of KPIs which are meaningful and actionable. Supplier Performance Metrics for Every Organisation. Other Supplier Performance Metrics. Returns rate metrics.
How Can USMTO Reports Help Drive Manufacturing Sales and your Bottom Line? The United States Manufacturing Technology Orders (USMTO) data report is compiled monthly by the Association for Manufacturing Technology (AMT). What is the USMTO Data Report? Why Wenzel America Uses the USMTO Data Reports.
The most common complaint of newer companies using big data analytics capabilities tends to revolve around traditional questions of business strategy. Transportation modes used in procurement and shipping. Distribution of goods prior to purchase. Ask Traditional Questions, and Let Big Data Provide Answers. Demand fluctuations.
Digital commerce efficiently requires the digitalization of many customer-facing operations and sourcing and procurement. The First Step: Bring all the data together and ensure analytics and planning can happen on the same platform. . Accurate and timely reconciliation of purchase orders with receipts.
It touches many departments, from production, procurement, shipping, accounting, and finance to marketing, warehousing, research and development, and sales. For example, a member of the sales team could apply to become a purchasing agent, based on her experience of negotiating sales deals. Why Choose a Job in the Supply Chain Industry?
“Paralysis by analysis” is a common term used to describe such a situation, and you can avoid it by monitoring a smaller number of carefully chosen KPIs. ” Feel free to track lots more metrics in the background if you wish, but try to keep attention focused on the five or six “real KPIs.”
Even if this retailer had used AI to forecast my purchase, AI that creates a perfect plan but fails to execute it only results in a highly-efficient silo, as Northeastern University professor Nada Sanders says. Events and disruptions are par for the course in supply chain, so we need tactics to kick in for problem resolution.
Of course, the investment is intended to impact the bottom line, but when employees feel that their organization cares about them and wants to make their lives better, they want to reciprocate and are more invested in the organization’s success. To simplify the issue, just think about how you can help current employees be successful.
can be measured to define this metric. Manufacturing Cycle Time : This metric is most accurately obtained using real-time monitoring with a Manufacturing Execution System (MES). Freight bill accuracy : Whether shipping from factory to warehouse, or to the customer, this metric helps identify problems in billing operations.
Sources cite the resiliency of essential services , predictive recurring revenue and business model growth opportunities enabled by technology, training and development as being reasons behind the interest. This might include an analysis of revenue, cost of goods sold, operating expenses and non-operating expenses.
Yes, the need for shipping demand analytics is not new and was echoed in 2013 by Industry Week , “Relying on traditional supply chain execution systems is becoming increasingly more difficult, with a mix of global operating systems, pricing pressures and ever-increasing customer expectations. That’s where data analytics comes in.”
Take a look at how the IoT supply chain is changing the landscape in terms of equipment functionality, shipping processes, invoicing and payments, and analysis of trends. Furthermore, the use of robotics in the order fulfillment, specifically the “item picking” processes , could help foster a faster purchase-to-delivery timeline.
Too much leads to resources being monopolised on gathering tons of data and a subsequent risk of “paralysis by analysis” Cost to Serve (CTS) is an approach that helps you avoid both extremes. It can of course also be used to make an already profitable relationship even more profitable! This sounds like common sense.
Of course, it is helpful to have some statistics on hand to validate the statement above. Conversely, just 8% of businesses with less capable supply chains report above-average growth. Development of analytical and network design skills within the company’s supply chain teams. you have to make your supply chain successful too.
If yours is one of those businesses shifting from traditional to online retail, you’ve probably faced some of the logistical challenges arising from the need to deliver your customers’ purchases to them. Those expenses can increase the cost to serve by a considerable amount. Identifying Cost Elements and Drivers. Equipment use.
It’s about understanding why key stakeholders which should include, vendors, purchasing, customer service, sales, are making the decisions that they do and how those decisions affect your supply chain. The data and analytics gathered during the measure phase is instrumental to a proper understanding of your operations.
As physical stores opened, shut down and re-opened again, consumers became more flexible in the way they shop for, and purchase, just about every product. As disruptive events occur along the digital thread, the entire organization can act in a fluid, connected manner to optimize costs, service levels and other outcomes.
Once the analysis was done for Year One set up, Year Two was pretty much the same. It was predictable. What PMI needed, considering the long planning horizons, was a digital and analytics network design and supply optimization tool. Analysis and scenario formulation lead time went from weeks to days.
But, of course, what those circumstances are is for you to decide. For example, US-based companies may be quite fortunate if they have access to manufacturers right on their doorstep in Mexico, a country with far lower labour costs than the rest of North America.
FedEx flew 9 percent fewer domestic flights last month than in June following small sequential gains the prior two months, with year-over-year flight activity down 14 percent, according to an analysis by investment bank Morgan Stanley. Until now, the minimum purchase for free shipping has been $25. Downing St.
MonkProtect MonkProtect is a post-purchase suite that helps ecommerce brands “stress less and grow more” by protecting ecommerce orders. In the obvious sense that is evident in our expanding international presence , globally competitive shipping solutions , and of course our aforementioned import and export services.
Quality and Detail of Data and its Analysis In some of our earlier posts, we’ve stressed the importance of simplicity in distribution network design , and we will return to that topic later in this article. It’s not a short list, so we’ll set it down here as a summary to help you with plans for analysis.
It’s taking semiconductor firms more than twice as long as their peers in other industries to hire personnel such as technicians or mechanical engineers, with the typical process stretching to about three months, according to an analysis of the top 50 chip producers in the US by Revelio Labs, a labor-market data analyst. percent to $65.5
billion, according to Adobe Analytics , up 7.5% Will consumers be reluctant to use credit cards for holiday purchases? For the first time, mobile purchases have overtaken desktop purchases. Shopify reports that sales were up 24% compared to last year, with 61 million consumers shopping globally this year.
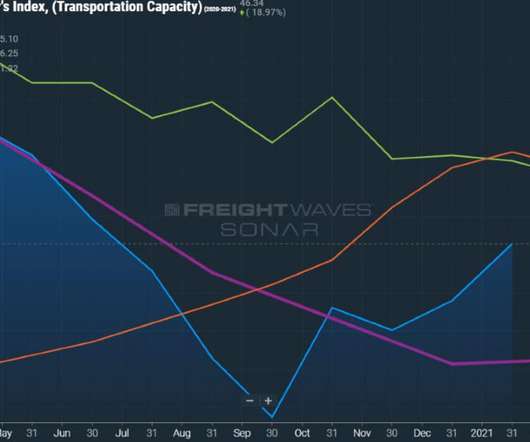
But with freight rates becoming more accessible, shouldn’t we be moving away from speculation and towards providing analytic responses? After each spike on the graph, the percentage against baseline slides during the course of the month, invariably finishing lower than baseline. Freight Rate Analytics Has Its Challenges.
The second is when you implement segmentation of the SKUs in your portfolio based on Pareto analysis. The products are dispatched straight from the factory and typically arrive within 48 hours of raising a purchase order. 2: Forecast Accuracy. Another product comes from an overseas manufacturer, with a lead time of several weeks.
Software vendors and those involved in the purchasing decision have always viewed “function” as more important than “form.” Of course, evaluating whether a software application meets your functional requirements remains critically important. Simply put, many user interfaces…. I also wrote….
Using AI driven product nature of being and smart attributes, data can be structured to support the needs of ERP applications as well as strategic sourcing and Value Analysis activities , all from one data set. These super-intelligent machines are already taking over factory workers, stock traders, data processors, even news reporters.
According to their 2017 annual report, over a quarter of Amazon’s third-party sales (which represent half of Amazon’s sales) are cross-border. Amazon’s trucking fleet is expanding rapidly; it launched in 2005 with the purchase of thousands of trailers used to shift goods between fulfillment centers. Team Analysis.
Darkness is an exaggeration, of course. The employees took care of purchasing from the Asian suppliers. On the other hand, changes in production or delivery times pose challenges because the supply chain is not transparent,” reports Keyser. Reporting: Here, the system offers comprehensive reporting and analysis functions.
Standardise and Digitise The key to managing complexity, of course, is to be organised. Ideally, you will calculate the cost as a percentage of the sales value of goods returned over a specific period. So what can you do to ensure your inventory management meets the challenge of multichannel sales?
In addition to real-time updates from the “order processed” to the “order handed off to customer” stages, reporting tools are key for order management within ecommerce software. Detailed Data and Reporting How much inventory do you need to order at a time? How much do I order? When should you order it?
Now of course, companies must map out the potential impacts of the Russia Ukraine war. The potential supply chain impacts of this conflict dwarf any other supply chain news that might be reported. Oil, gas, steel and metal products account for other everyday items purchased from the two countries.” Russia Attacks Ukraine.
Conversely, just 8% of businesses with less capable supply chains report above-average growth. 2) According to a 2012 report into corporate insolvencies by the Australian Securities and Investments Commission, 44% of businesses in Australia failed because of poor strategic management. Procurementcosts. Click To Tweet.
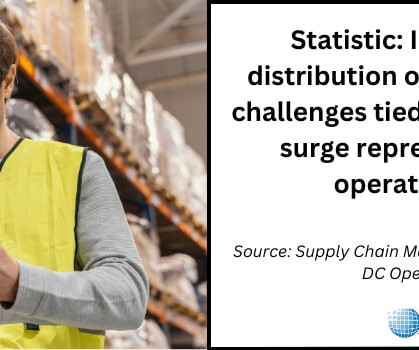
Recent studies have shown that among the challenges frustrating warehouse and distribution centre managers this year, rising energy and labour costs are two of the most often cited. Of course, the most challenging part of any benchmarking project is accessing other companies’ data against which to compare your warehousing performance.
We organize all of the trending information in your field so you don't have to. Join 84,000+ users and stay up to date on the latest articles your peers are reading.
You know about us, now we want to get to know you!
Let's personalize your content
Let's get even more personalized
We recognize your account from another site in our network, please click 'Send Email' below to continue with verifying your account and setting a password.


Let's personalize your content