This site uses cookies to improve your experience. To help us insure we adhere to various privacy regulations, please select your country/region of residence. If you do not select a country, we will assume you are from the United States. Select your Cookie Settings or view our Privacy Policy and Terms of Use.
Cookie Settings
Cookies and similar technologies are used on this website for proper function of the website, for tracking performance analytics and for marketing purposes. We and some of our third-party providers may use cookie data for various purposes. Please review the cookie settings below and choose your preference.
Used for the proper function of the website
Used for monitoring website traffic and interactions
Cookie Settings
Cookies and similar technologies are used on this website for proper function of the website, for tracking performance analytics and for marketing purposes. We and some of our third-party providers may use cookie data for various purposes. Please review the cookie settings below and choose your preference.
Strictly Necessary: Used for the proper function of the website
Performance/Analytics: Used for monitoring website traffic and interactions
If youve followed our blog over the years, youll know that weve shared lots of information about distribution network design, why its vital to get it right, how long it should take, the importance of reviewing the network every so often, and various elements of design such as determining the number of warehouses and where to locate them.
Energy management solutions are products that energy utilities use to produce power and data centers use to consume power. The supply chain has about 190 factories and 100 distribution centers. By 2014, the company had purchased the Coupa solution, developed an internal modeling team, and created data extraction and cleansing routines.
As businesses strive to stand out, leveraging data effectively has become a game-changer. One of the most powerful yet underutilized tools for achieving this is decile data analytics. What Is Decile Data? The resulting data makes it easier to make smart data driven decisions on individuals that make up service target markets.
As logistics networks become increasingly complex, the volume of real-time data generated by devices, equipment, vehicles, and facilities is growing rapidly. Edge computing processing data locally, near the source has emerged as a method to address these challenges by reducing latency and improving resiliency.
Krenar Komoni has developed breakthrough ideas in data analytics, logistics, and electronics design for nearly 20 years. As an innovator and market leader, he has successfully developed and led cross-functional teams while enhancing business performance in sales, finance, supply chain logistics, distribution, and manufacturing.
These sensors capture precise data on factors like location, speed, fuel usage, and driver behavior, transforming fleet management from reactive to data-driven decision-making. The IoT data allows managers to detect inefficiencies, predict maintenance needs, and even assess driver performance.
Inventory Management The key starting point is implementing proper ABC analysis, and you need to look at it from multiple angles. It’s not enough to just categorise by product groups; you’ve got to dig deeper into line item analysis. And the foundation that holds all of this together is your master data.
This collaboration aims to deliver advanced tools to streamline workflows and improve finances across distribution and warehouse operations. Together, the companies will provide businesses with powerful labor insights for workflow analysis, benchmarking, and forecasting across their networks.
Understanding AI Agents At its core, an AI Agent is a reasoning engine capable of understanding context, planning workflows, connecting to external tools and data, and executing actions to achieve a defined goal. Integrate with External Tools and Data: AI Agents can augment their inherent language model capabilities with APIs and tools (e.g.,
But by implementing data driven maintenance strategies these cost, performance, and environmental impacts can be greatly reduced. An intelligent data-driven approach Maintenance doesn’t have to be this arbitrary. None of this is good for sustainability.
To do that, you need to access accurate data and create insightful reports for GL, as well as other finance and operational needs. The challenge is that many teams also rely on manual data exports from their ERP or ‘data dumping’ into Excel to report on and analyze their data beyond what standard reports offer.
DHL provides shared or dedicated warehousing and goods distribution solutions for storing raw materials, consumables, spare parts, and finished goods. DHL LifeConEx is a premium and customized temperature-controlled air freight service that provides post-shipment diagnostics, cold chain optimization, and dataanalysis services.
billion rate data points monthly to provide the most comprehensive view of the market, helping you identify savings opportunities and make data-driven decisions. billion rate data points monthly to provide the most comprehensive view of the market, helping you identify savings opportunities and make data-driven decisions.
Traditional supply chain planning, which relies on historical data and reactive adjustments, is no longer adequate for managing these challenges. Limitations of Traditional Supply Chain Planning Traditional supply chain planning relies on retrospective analysis.
If you’ve followed our blog over the years, you’ll know that we’ve shared lots of information about distribution network design, why it’s vital to get it right, how long it should take, the importance of reviewing the network every so often, and various elements of design such as determining the number of warehouses and where to locate them.
quintillion bytes of data every day. For companies that want to go beyond the traditional spreadsheet, which cannot handle this ocean of information efficiently, statistical methods such as cluster analysis can help. What is Cluster Analysis? The retail industry is rich with data. On average, we humans generate 2.5
Over the last decade, the role of the manufacturing and distribution CFO has undergone a profound shift. The role of the CFO is being transformed by technological innovation and access to massive amounts of data, both inside and outside the organization. Here’s ERP ROI for the manufacturing and distribution CFO: 1.
Data is the lifeblood of AI in the supply chain. Without sufficient data, AI models can’t uncover meaningful patterns, make accurate predictions, or provide valuable insights for informed decision-making in complex and dynamic environments. At the same time, feeding your AI models too much data can also be a problem.
They emphasized being an Industry Cloud Complete Company with industry-specific solutions for over 2000 micro verticals across Process Manufacturing, Distribution, Service Industries, and Discrete Manufacturing. Concepts like GenAI Assistants and Agents were presented, offering conversational interfaces and on-demand analysis.
Data is the new precious metal and it is becoming more essential than ever before. Technological leaps like blockchain, artificial intelligence and machine learning run on data. Careful and Regular Data Collection is Critical Data management is not a “set it and forget it” activity.
Meeting today’s logistics challenges of the three C’s – customer service, carbon, and cost – companies are not just looking at gathering data, but also how to better interpret and understand this data, and then use it to drive additional value. How about your need for a seamless corporate transportation analysis?
You can also consider setting up regional distribution centres to reduce long haul transportation, and hybrid or electric vehicles for last mile delivery where possible. Data Driven Carbon Tracking and Reduction Having robust carbon tracking across your supply chain enables better decision making and continuous improvement.
It encompasses multiple aspects such as transportation, warehousing, loading and unloading, packaging, circulation processing, distribution, and information processing. Booking Processing : RPA can automatically scan and digitize booking documents in various formats and then automatically enter the data.
She has led programs ranging from acquisitions to technology deployment with a strong focus on lean manufacturing and data management. Companies will need to implement solutions that give this data in real-time or in the shortest time possible. can be created to serve as a sandbox for scenario analysis. About CarrierDirect.
Have you conducted a cost-to-serve (CTS) analysis for your enterprise? And that is the sole purpose of cost-to-serve analysis. If you were going to say, “What is a cost-to-serve analysis?” Only a complete cost-to-serve analysis will expose these underlying issues unless they happen to be discovered incidentally.
Distributed Inventory — At ShipMonk, inventory can be distributed to twelve owner-operated fulfillment centers in the US, Mexico, Canada, UK and Europe and managed in real-time through a centralized warehouse management system (WMS).
Krenar Komoni has developed breakthrough ideas in data analytics, logistics, and electronics design for nearly 20 years. As an innovator and market leader, he has successfully developed and led cross-functional teams while enhancing business performance in sales, finance, supply chain logistics, distribution, and manufacturing.
Supply chain leaders are enthralled with the idea of using big data, but they tend to fail to understand how to disseminate big data in their organization properly. True, they may know how to roll out big data in a single warehouse, or they may have heard their competitors used branded systems for implementing this new technology.
Global trade data and shipping demand management are not just things that high-tech companies and international investors need to worry about. This focus makes proper use of global trade data and analytics so vital for continued recovery and growth throughout the supply chain network. Streamline data collection and analysis.
This moment goes beyond analysis and reflection; it is the right opportunity to redefine strategies and outline new plans that not only drive results but also guarantee a prominent place in the market. It is also critical that processes are highly coordinated, allowing for a comprehensive perspective of the entire operation.
Edge Hardware: The battle for edge hardware also intensified in 2024, as companies sought to deploy AI capabilities closer to the source of data. These developments help enable real-time data processing, reduce the reliance on cloud connectivity, and democratize access to advanced AI technologies in industrial and robotic contexts.
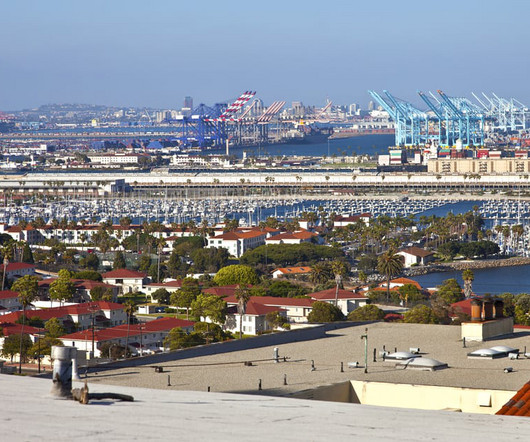
West Coast ports, a group of five California ports will partner to create a game-changing data-sharing system for seamless shipments. Working together, the alliance of California ports will seek to unify currently siloed data and solve visibility issues, a major reason for supply chain disruptions at U.S. In major news for U.S.
I’ve noticed a trend in recent years in that when businesses want to check their distribution networks or design a distribution network , they immediately jump into loads and loads of detail. You don’t have to launch into something very data-intensive. If the data is good , it’s probably a three-to-four-month project.
Each vertical is an industry itself, such as warehousing or e-commerce/last-mile distribution. The only way organizations can manage large-scale operations and ease the workload of their staff, clients, and vendors is by transmitting most data digitally, implementing a robust digital process.
Data-driven transportation management , including the checks and reviews that accompany healthy data management practices, are part of the process of getting the most out of the tech stack. This remains key to the overall success of investments within supply chain analysis. Things will go wrong. Think about it.
In the grand scheme of things, dataanalysis falls into the categories of descriptive, predictive, and prescriptive. While descriptive data presents existing figures, predictive data allows you to draw insights from trends in your descriptive data in order to make an educated guess about what might happen next.
Longer lead times, complex handoffs between logistics providers, data flow between disparate systems…requires a new way of thinking for efficient inventory moves from origin to the final customer efficiently. He also provides insights into merchandising and workforce management solutions and runs RSR’s consumer research.
Today’s most successful green industry companies approach print marketing with the same data-driven mindset they bring to their digital campaigns. When a prospect mentions “SPRING25” on a call, scans your QR code or dials your tracking number, you gain valuable data that shapes future marketing decisions.
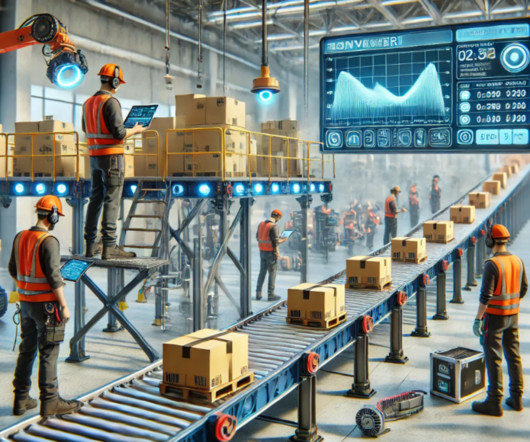
Here are some ways adopting automation processes can help support your company’s sustainability goals: Efficient energy use : Automation technologies can optimize energy in manufacturing and distribution processes. This can lead to lower emissions from transportation and warehousing activities, and decreased reliance on fossil fuels.
billion rate data points monthly to provide the most comprehensive view of the market, helping you identify savings opportunities and make data-driven decisions. billion rate data points monthly to provide the most comprehensive view of the market, helping you identify savings opportunities and make data-driven decisions.
Measuring a sample of more than 1 million items from five leading retailers and eight brand owners, the study also found that when RFID was not implemented, 69 percent of orders shipped and received from brands to their retailer partners contained data errors.
The solution can answer questions like where should new production or distribution capacity be located to optimally accommodate anticipated growth in demand? At this point, they do not include distribution reduction costs. From a process perspective, an analysis is not enough. What factory should make a new product?
Use tools to automate root cause analysis and reduce dependency on manual reporting. As Dritz noted, Collaboration with distribution partners and manufacturers can drive tremendous value by aligning core competencies and sharing demand plans. Examples include: Labor Planning: Optimize workforce productivity based on real-time data.
They’re also the center for the manufacturing, assembly, labeling, organization, coordination, separation, distribution, and transportation of goods for national and international transit. Typically, logistics hubs house offices, storage facilities, warehouses, distribution centers, trucking, and shipping services.
We organize all of the trending information in your field so you don't have to. Join 84,000+ users and stay up to date on the latest articles your peers are reading.
You know about us, now we want to get to know you!
Let's personalize your content
Let's get even more personalized
We recognize your account from another site in our network, please click 'Send Email' below to continue with verifying your account and setting a password.


Let's personalize your content