This site uses cookies to improve your experience. To help us insure we adhere to various privacy regulations, please select your country/region of residence. If you do not select a country, we will assume you are from the United States. Select your Cookie Settings or view our Privacy Policy and Terms of Use.
Cookie Settings
Cookies and similar technologies are used on this website for proper function of the website, for tracking performance analytics and for marketing purposes. We and some of our third-party providers may use cookie data for various purposes. Please review the cookie settings below and choose your preference.
Used for the proper function of the website
Used for monitoring website traffic and interactions
Cookie Settings
Cookies and similar technologies are used on this website for proper function of the website, for tracking performance analytics and for marketing purposes. We and some of our third-party providers may use cookie data for various purposes. Please review the cookie settings below and choose your preference.
Strictly Necessary: Used for the proper function of the website
Performance/Analytics: Used for monitoring website traffic and interactions
Data is a big buzzword across industries, but how about when it comes to logistics? William shares how they transform data into critical actionable information that optimizes and powers operations throughout businesses. Beyond The Data with William Sandoval. Our topic is beyond the data with my friend William Sandoval.
Transportation Management software offers you a way to view insightful data, gain visibility, and better manage all the moving parts in the shipping process. Are you using programs like Excel and Outlook to manage your shipments? Are you using programs like Excel and Outlook to manage your shipments? your logistics? Benefits of?Transportation
To remain competitive, retailers and carriers must excel in the crucial last-mile delivery stage. To Build or To Buy Companies looking to implement new or improve existing delivery technology face a crucial decision: should they build an in-house platform or buy an existing solution from a vendor?
A fleet management system is used to plan a business’s logistics based on an assessment of historical delivery data and to monitor the performance of each vehicle based on tracking technologies such as GPS and telemetry sensors. Quality, aiming to reconcile excellence and savings in favor of a good service provided.
One of the significant challenges our clients battle is winning management buy-in to EHS initiatives when their eyes are laser-focused on the bottom line. For added ammunition, your argument should be supported by measurable data points. But how do you document that mountain of EHS data? How do you get their attention?
Measuring performance with transportation KPIs and freight data is getting easier. Without excellent and clear communication, these trends will not be identified and acted upon until it is too late. Transportation management depends on historical and real-time data. Think about this.
Most importantly, do I want to buy the software outright or outsource? And if you’re looking to purchase software outright versus outsourcing with a 3PL, you’ll soon realize that not all transportation management software companies offer the same thing. A 3PL can be an excellent option for a transportation management provider.
More freight brokers are turning to technology and transportation data to grow their businesses by understanding the true freight market rate. . It’s not solely about knowing basic rates – it’s about using freight data to make the best decisions for all loads – playing both the buy-side and sell-side aspects of freight brokering.
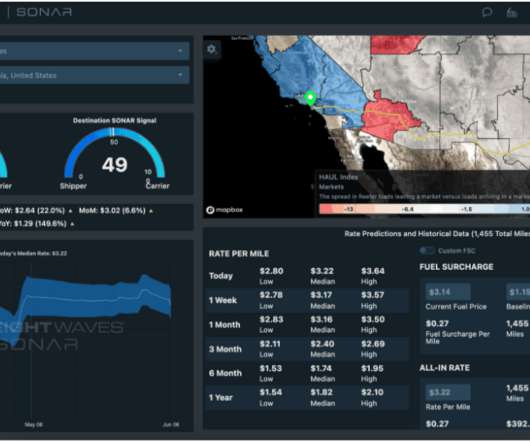
Since its introduction in 2018, FreightWaves SONAR has provided subscribers with the most current freight market data, analysis and insights. SONAR is the only freight forecasting platform that combines contract tender data with spot rate data and creates predictive freight rates.
This fragmented approach leads to redundant data entry, lack of coordination and inefficiencies that consume valuable time and resources. With an ERP, all departments are looking at the same data. An ERP system lets you see manufacturing data accurately and in real-time. Sales can see inventory quantities and production jobs.
Too much leads to resources being monopolised on gathering tons of data and a subsequent risk of “paralysis by analysis” Cost to Serve (CTS) is an approach that helps you avoid both extremes. If profits start to decline afterwards, your CTS data can offer valuable information about what changed and how to get back on track.
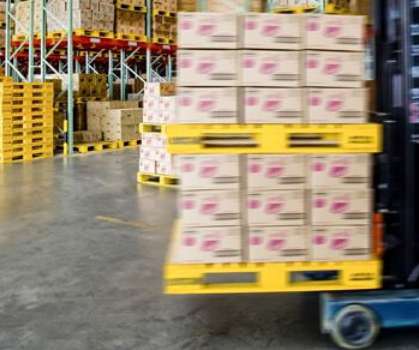
For these investment purchases, consumers expect a high level of service including room of choice placement and assembly. Managing delivery exceptions for excellent customer experience. The consumer second guesses their decision to purchase that large treadmill and refuses the delivery upon arrival.
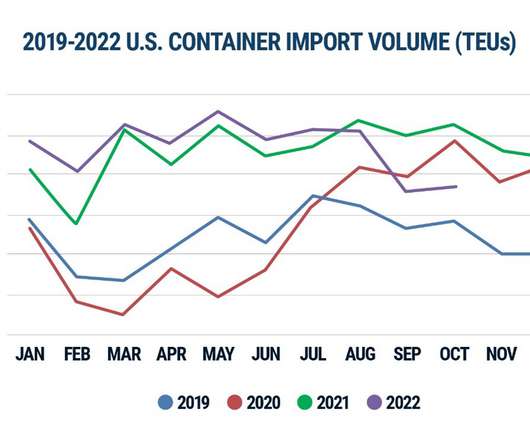
Let’s take a look at what happened with the major themes, as well as the research and analysis we conducted in 2022 to help determine what those themes will look like in 2023. Theme 2: Online buying will fuel home delivery growth, challenges and new strategies. Theme 1: Global supply chains will be busy, congested and chaotic.
Data-driven analytics enables you to make cost-effective transportation decisions. However for most shippers, parcel spend is poorly understood because shipping data is often locked up in point solution silos, such as carrier-provided systems and websites, in a variety of different formats. But no longer.
Specifically, through modeling and simulation of a digital twin you’re able to ‘virtually try before you buy’ — modelling different scenarios quickly and easily without interrupting operations, or committing significant time and capital. Do they purchase a 3D warehouse simulation and modeling tool?
The application of data can help shippers gain control of shipping costs and make informed decisions, and the top freight data trends for 2019 exemplify how the use of a transportation management system (TMS) can further this cause. As omnichannel shopping becomes the standard for consumers, the use of freight data will excel.
Below I will outline how a vendor managed inventory model, in conjunction with reverse marketing, value analysis, and collaboration will achieve supply chain cost reductions. The manufacturer has access to the distributor’s inventory data and is responsible for generating purchase orders. What is Value Analysis?
This technology allows businesses to unify their procurement, expense management, invoicing, payments, contract management, and spend analysis processes and reporting. The visibility to spend allows them to provide excellent benchmarking in several areas. Initially, this product will focus on the purchase order (PO) acceptance process.
Once the analysis was done for Year One set up, Year Two was pretty much the same. They gave River Logic cost, lead time, and other data on five factories, and requested they built a validated network model as soon as possible. Analysis and scenario formulation lead time went from weeks to days. It was predictable.
Data Capture. Shipping freight inherently comes with a large amount data. Each data entry is an opportunity for data capture and analysis. Additionally, ensuring a superior data capture capability allows clients to become more confident in tracking and visibility in shipping. Freight Spend Management.
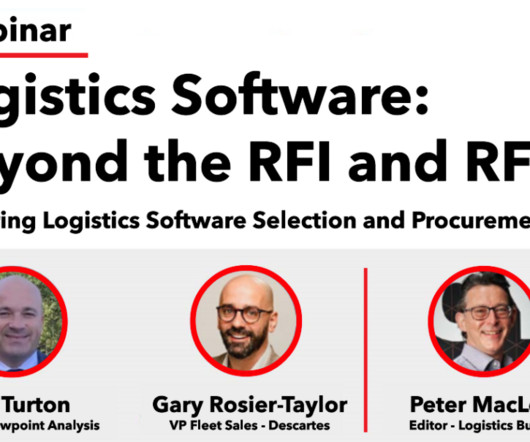
Achieve Supply Chain Excellence’, where industry experts will guide you through mastering the logistics software selection and procurement process. Are you planning to buy new logistics software in the next 12 months? Engage stakeholders for alignment and buy-in. Avoid common pitfalls in software selection.
For example, a member of the sales team could apply to become a purchasing agent, based on her experience of negotiating sales deals. The main lack of talent is in middle management, especially in big data analytics and supply chain planning, where the shortage is around 54%. You could be particularly numerate, or into analysis.
Treating the process like a purchase For successful logistics outsourcing, understanding the true nature of the relationship you’re creating is important. Absence of internal buy-in Nothing can derail a partnership faster than finger pointing and negativity within your own operation. No Pain; No Gain?
Whether you are looking to gain more customers, increase your company revenue size or add more trailers to your fleet, SONAR has information and data to help you with these decisions. OTVI was indexed at 10,000 on January 1, 2018, so when looking at this data set, the trend of the line is more important than the actual value.
Scorecard analysis, % to all goals, and critical path: “What KPI is holding us back from overall success? At the performance review employees think they have done excellent work but their manager gives them a low rating at their annual appraisal. Performance Appraisal/Review System. Are they meeting all of their goals? What is lacking?
In a nutshell, ShipMonk’s proprietary 3PL software offers you mastery of: Order Management Inventory Management Warehouse Management Fulfillment Automation Market Integrations All Order Data (Real-time and Historical) Add to that, when using ShipMonk 3PL software, you’ll always have complete transparency and access to customer support.
GEON Performance Solutions purchases plastic pellets and add plastic compounders to make products of different strength, resilience, and flexibility. At a high level, what GEON does is purchase plastic pellets and add plastic compounders to make products of different strength, resilience, and flexibility.
The other part of my role is supporting the inventory management functions within BT Group, driving decision-making around what we buy, when we buy, and where from. We are using Network Design Navigator for two purposes with different data sets: The first one is to optimize proximity in our network allocation for engineers.
Whether you are looking to gain more customers, increase your company revenue size or add more trailers to your fleet, SONAR has information and data to help you with these decisions. OTVI was indexed at 10,000 on January 1, 2018, so when looking at this data set, the trend of the line is more important than the actual value.
SONAR customers who contribute to the Trusted Rate Assessment Consortium (TRAC) have access to benchmarking data for their rates, along with market indicators that allow them to gain an understanding of their competitive advantages and opportunities in order to increase their margins and revenue.
It also offers improved efficiencies and powerful data insights, providing a wealth of functionality to help during these difficult times. The era of using spreadsheets to run reports and analyze data is over. These will be much more accurate than using a 30-day rolling average calculation in Excel or an ERP.
There are few tools in the industry that can also utilize what-if analysis to plan for segments of the year - such as seasonality, peaks/valleys based on marketing campaigns, or regional opportunity planning. Some companies still are even using manual processes with Excel spreadsheets to track their inventory!
Logistics Excellence: Now & in the eFuture. Eliminating paper from their delivery operations was a common objective for these companies, along with improving productivity, customer service, and data quality. getting buy-in from drivers and other stakeholders) and implementing appropriate metrics to measure and drive performance.).
The second is when you implement segmentation of the SKUs in your portfolio based on Pareto analysis. The products are dispatched straight from the factory and typically arrive within 48 hours of raising a purchase order. You might have excellent processes and exemplary management protocols. 2: Forecast Accuracy.
Companies must also consider cost implications, accurate demand forecasting, trend analysis, process automation, and logistics considerations. Accurate demand forecasting and trend analysis enable companies to anticipate customer needs, ensuring products are available when and where they’re wanted.
Confused and unimpressed customers don’t click BUY. Sometimes prospective customers can be torn between buying the product they’re after from one seller vs. another. So incentivize buyers who don’t send items back (and therefore are likely satisfied with their purchases) to leave reviews for your brand.
Big dataanalysis and forecasting. The use of data will help your company forecast which products will be in high demand during the holiday season. Even with an excellent plan A, there should always be a plan B to cover your back. Use automated tools and customer management systems to collect and analyze information.
In terms of how RPA helps improve the agility and quality of supply chain processes, the tool makes it possible to manage invoicing more effectively by automating actions like sending purchase orders and downloading and uploading documents and receipts.
Likely the most well-known trade magazine, it provides data-rich material relevant across the supply chain. The businessman’s news source of choice, global export and import volumes (as well as buying trendings) are key to informing supply chain professionals. Paid Premium. Journal of Commerce (5 a month). joc_updates.
Many renewable energy organizations are missing out on the benefits of ERP software that would allow them to tackle the challenges of data management, improve process efficiency across the organization, and manage projects more effectively. Data across the business is available in real time, keeping operations running smoothly and on time.
Developed a process of excellence in supply chain collaboration. As a result, the newly merged company developed a systematic methodology for network design optimisation, based on the following four principles: A continual process of high-powered modelling and network design analysis. Pioneered the use of vendor-managed inventory.
In addition, while rivers and mountains stay where they are, other geographical features, like conurbations, change over time; associated factors such as labour availability and customer buying habits may change even faster. Now There are Data Warehouses Too. Some choices, when based on these factors, can be surprising at first glance.
The employees took care of purchasing from the Asian suppliers. “On one hand, the effort involved via Excel and email is huge. After consultations with Setlog Managing Director Ralf Duester and an analysis of other providers, the contract was signed in August 2022 and the project launched immediately.
Detailed analysis of more than 85,000 vehicle records by Michelin Connected Fleet’s data science team found the average internal combustion-engined (ICE) van travels 63 miles per day, compared with just 28 miles for an electric LCV. “In Electric vans overcharged.
We organize all of the trending information in your field so you don't have to. Join 84,000+ users and stay up to date on the latest articles your peers are reading.
You know about us, now we want to get to know you!
Let's personalize your content
Let's get even more personalized
We recognize your account from another site in our network, please click 'Send Email' below to continue with verifying your account and setting a password.


Let's personalize your content