This site uses cookies to improve your experience. To help us insure we adhere to various privacy regulations, please select your country/region of residence. If you do not select a country, we will assume you are from the United States. Select your Cookie Settings or view our Privacy Policy and Terms of Use.
Cookie Settings
Cookies and similar technologies are used on this website for proper function of the website, for tracking performance analytics and for marketing purposes. We and some of our third-party providers may use cookie data for various purposes. Please review the cookie settings below and choose your preference.
Used for the proper function of the website
Used for monitoring website traffic and interactions
Cookie Settings
Cookies and similar technologies are used on this website for proper function of the website, for tracking performance analytics and for marketing purposes. We and some of our third-party providers may use cookie data for various purposes. Please review the cookie settings below and choose your preference.
Strictly Necessary: Used for the proper function of the website
Performance/Analytics: Used for monitoring website traffic and interactions
Each technician visit, customer interaction and service delivery generates valuable data points. What is a data warehouse? What is a data warehouse? A data warehouse is a comprehensive system that collects, organizes and delivers business information in a way that makes it immediately useful.
Data is a big buzzword across industries, but how about when it comes to logistics? William shares how they transform data into critical actionable information that optimizes and powers operations throughout businesses. Beyond The Data with William Sandoval. Our topic is beyond the data with my friend William Sandoval.
A single, centralized source of truth for your organizations data is no longer a luxuryits a necessity for businesses seeking to scale efficiently, enhance profitability, and make informed, data-driven decisions. This leads to: Inconsistent reporting: Different branches track data differently, making comparisons difficult.
Why Modern Data Warehouses Are No Longer Optional A centralized data warehouse is becoming an essential solution for businesses looking to scale efficiently and optimize operations. It’s no longer just a “nice to have,” but a critical repository for processing vast amounts of business data.
Speaker: Brian Dooley, Director SC Navigator, AIMMS, and Paul van Nierop, Supply Chain Planning Specialist, AIMMS
When you finally have the analysis, everything has changed, and it is no longer relevant. This on-demand webinar shares research findings from Supply Chain Insights, including the top 5 obstacles that bog you down when trying to improve your network design efforts: Poor data quality. Lengthy time to plan/execute.
As businesses strive to stand out, leveraging data effectively has become a game-changer. One of the most powerful yet underutilized tools for achieving this is decile data analytics. What Is Decile Data? The resulting data makes it easier to make smart data driven decisions on individuals that make up service target markets.
Energy management solutions are products that energy utilities use to produce power and data centers use to consume power. By 2014, the company had purchased the Coupa solution, developed an internal modeling team, and created data extraction and cleansing routines. They only promise at most 50% of the savings shown by the analysis.
Table of Contents [Open] [Close] Significance of Last-Mile Delivery Optimization Implementing Innovative Strategies The Role of Data Analytics Sustainability: A Necessary Focus 1. Data-driven approaches, such as predictive analytics, facilitate real-time adjustments in delivery operations. Electric and Alternative Fuel Vehicles 2.
For these companies, maintaining profitability while protecting their margins hinges on operational efficiency and the strategic use of data. Data is critical to managing every dimension of the business. Lets explore how AI and BI empower these industries, using specific examples to illustrate their transformative potential.
Increasing supply chain data visibility is a priority for logistics organizations looking to improve resilience. Supply chain recovery hinges on incorporating robust data analytics and other data-driven tools into business operations to increase efficiency, reduce costs and proactively manage risk.
Inventory Management The key starting point is implementing proper ABC analysis, and you need to look at it from multiple angles. It’s not enough to just categorise by product groups; you’ve got to dig deeper into line item analysis. And the foundation that holds all of this together is your master data.
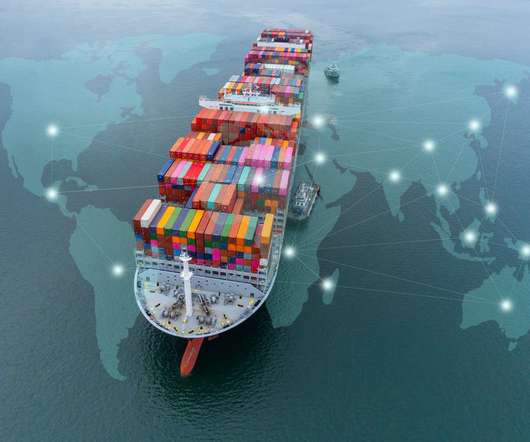
For the first time, there is real-world data that shows that wind power could be a viable source of energy to power container ships in the near future. Encouraging data has been released on using wind power for powering a cargo ship, according to the BBC. What did the results of the months-long test show?
I have recently completed the latest ARC Advisory Market Analysis on Global Trade Compliance, available here. Uyghur Forced Labor Prevention Act (UFLPA) and the European Unions Forced Labor Regulation (FLR) are prime examples of this tightening framework. Consequently, demand for robust GTC solutions will continue to rise.
5G networks significantly improve data transmission speed, latency, and device connectivity, revolutionizing supply chain operations. This setup allows teams to collaborate in real time, sharing video and diagnostic data across geographies. Next lets look at technical capabilities and applications in the domain.
Quality and Detail of Data and its Analysis In some of our earlier posts, weve stressed the importance of simplicity in distribution network design , and we will return to that topic later in this article. It would be folly not to take advantage of data availability and accessibility.
This year, a recurring theme that I saw was about using supply chain data to improve the customer experience across the entire value chain. Here are the ones that stood out to me, especially as it relates to supply chain data. The single data cloud runs on Snowflake, one of Blue Yonder’s partners.
Let’s look at my 7 truths of customer service that every business should consider; Most companies don’t truly know their customers’ service needs, though they think they do This often stems from insufficient customer interaction, lack of surveys, and limited performance measurement Even after working with thousands of businesses over (..)
Data is the new precious metal and it is becoming more essential than ever before. Technological leaps like blockchain, artificial intelligence and machine learning run on data. Careful and Regular Data Collection is Critical Data management is not a “set it and forget it” activity.
The pace and scope of supply chain disruption are beyond human cognition, manual analysis, and consumer-grade spreadsheet tools. They can ingest large volumes of functional data and leverage advanced intelligence to recognize broad trends and specific disruptive events. billion to $23.07
In a prior post , I wrote about the various ways data is transforming global supply chains. Data is the raw fuel of digital transformation and the linchpin to accelerating industry collaboration, automation, predictive insights and so many more cutting-edge capabilities (including those yet to be invented). So, what is quality data?
Meeting today’s logistics challenges of the three C’s – customer service, carbon, and cost – companies are not just looking at gathering data, but also how to better interpret and understand this data, and then use it to drive additional value. How about your need for a seamless corporate transportation analysis?
RPA technology simulates human operations in digital systems, such as data entry, file processing, and information transmission, achieving full automation of key processes from booking to order. Booking Processing : RPA can automatically scan and digitize booking documents in various formats and then automatically enter the data.
Have you conducted a cost-to-serve (CTS) analysis for your enterprise? And that is the sole purpose of cost-to-serve analysis. If you were going to say, “What is a cost-to-serve analysis?” Only a complete cost-to-serve analysis will expose these underlying issues unless they happen to be discovered incidentally.
What is ABC Analysis? ABC inventory analysis is a method used to classify a business’s stock items into three categories – A, B and C, based on their value to the business. In this blog post we’ll delve deeper into the intricacies of ABC analysis and how it can help businesses improve their inventory management practices.
Chemical manufacturers collect and use a lot of data in their supply chain. They deal with data on their products, customers, transportation, storage, operations and more. Acquiring that data is not hard but managing and utilizing that information to be able to analyze your business is the challenge. Lane Analysis Reports.
We experience such diverse supply chain disruptions that tracking the data on U.S. For example, recently Target was forced to write down the value of excess inventory that’s stuck in warehouses. The post Global Logistics Market Analysis: 2022 Summer Edition appeared first on More Than Shipping. Furthermore, T.J.
Data for data’s sake lacks value, especially in the view of the supply chain. And across the market, submitted data becomes rapidly outdated. And in some industries, outdated data can have disastrous consequences. For instance, take the value added by more accurate data in the health industry.
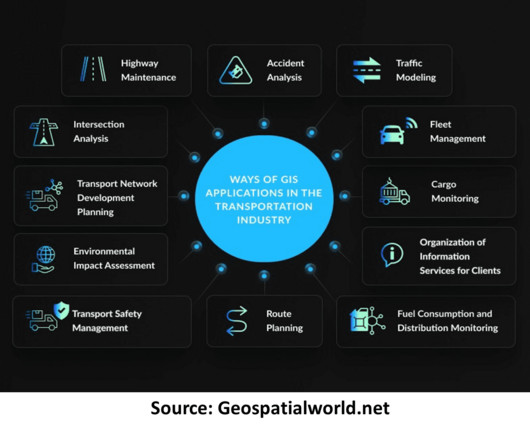
So, when I learned that GIS can effectively be used for traffic analysis and management, my interest piqued. GIS is a powerful tool that enables the analysis and visualization of spatial data, allowing for the integration of geographical elements into transportation planning and management. How Does GIS Help?
AI systems get better and more accurate as they collect and analyze more data. ML is a form of AI that enables a system to learn from data rather than through explicit programming. ML is a form of AI that enables a system to learn from data rather than through explicit programming.
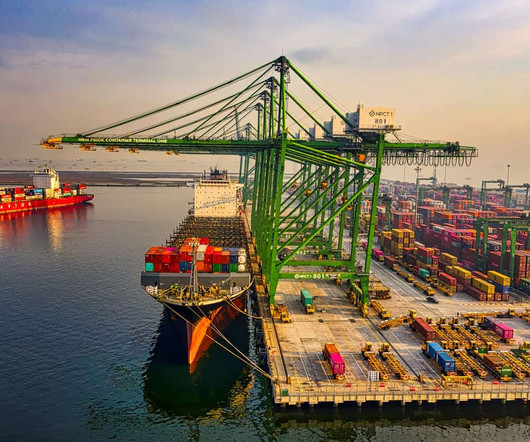
So, going into 2025, I would like to focus on current congestion data, global trends and what U.S. For example, numerous ports are still severely congested today. . & Europe, insufficient infrastructure in West Africa and parts of South America, and a surge in general volumes were the main factors behind all the issues.
Edge Hardware: The battle for edge hardware also intensified in 2024, as companies sought to deploy AI capabilities closer to the source of data. These developments help enable real-time data processing, reduce the reliance on cloud connectivity, and democratize access to advanced AI technologies in industrial and robotic contexts.
ITR Economics analysis shows rising and unmet demand for electric power from sustainability initiatives, coupled with the proliferation of data center construction ($27.3 For example, the global logistics automation market is expected to grow from $50 billion in 2023 to $120 billion by 2030, according to Allied Market Research.
Despite all these issues, cargo handled has rose a whopping 22% in the period of December 2021/January 2022/February 2022 compared to the December 2020/January 2021/February 2021 period according to data from the Port of Houston. The post Analysis: Should You Redirect Your Cargo and If So, Where?
For example, switching from air to ocean freight for non-time sensitive shipments can reduce carbon emissions by up to 95% per unit shipped. Data Driven Carbon Tracking and Reduction Having robust carbon tracking across your supply chain enables better decision making and continuous improvement. How can we help?
Internet of Things (IoT) sensor-generated data is another key piece of improving railway efficiency and operations. Accordingly, the number of IoT transport units is expected to increase , according to Statista data, from 2.6 Optimizing Railway Operations with Data. Making Data One’s Own. million in 2017 to 3.7
Erwin highlighted the importance of real-time data accuracy and visibility. People, technology, and data are very important for their journey. The importance of employee ownership in driving cultural transformation and their acceptance of data-driven decision making within the organization was also emphasized.
For example, an analysis carried out by AIR on the potential impact of Hurricane Harvey on regional manufacturing found that, based on percentage of the total potential revenue loss, the top three subsectors are petroleum and coal products manufacturing (37%), chemical manufacturing (13%), and oil and gas extraction (12%).
A KPI is a practical and objective measurement of progress, either: Towards a predetermined goal, or Against a required standard of performance It might help to think of a KPI as something like an instrument on a car dashboarda speedometer, for example. Why Are KPIs Important? Nonetheless, it is essential to have a hierarchy of KPIs.
Generative AI is first trained on a foundational model and then fine-tuned with human feedback and additional data. Its responses are based on data it has consumed and a resultant powerful prediction mechanism. That is one example of a public version of Generative AI. Now, none of these are really new technologies.
What are some examples of Supply Chain Automation? Predictive Analytics and Demand Forecasting – Modern supply chain systems analyse historical data, market trends and even weather patterns to predict future demand. The system validates the order, checks inventory, allocates stock and generates picking lists in seconds.
Transportation Management software offers you a way to view insightful data, gain visibility, and better manage all the moving parts in the shipping process. How do you gather and view data? Through a TMS, you can automate and optimize your processes, gain visibility into your logistics, and view valuable data.?. your logistics?
Manufacturers and distributors want to dramatically increase their efficiency, productivity and accuracy through smart technologies, data analytics and connected services. Digitization: from analogue information to digital data. The first step, therefore, is to get all your information – documents and data – into a digital format.
It has become a term applied to applications that can perform tasks a human could do, like analyzing data or replying to customers online. Machine Learning is just that – a machine or program that can learn from data. In the 2000s, big data came into play, giving AI access to massive amounts of data from various sources.
I tend to use time series analysis as an anchor to my forecast, as I suspect many of you do. For example, in a recent CNBC interview Ben Bernanke noted that the Federal Reserve likely looked at the unemployment rate and total employment in early 2021 and inferred that there was plenty of slack in the labor market. Final Word.
We organize all of the trending information in your field so you don't have to. Join 84,000+ users and stay up to date on the latest articles your peers are reading.
You know about us, now we want to get to know you!
Let's personalize your content
Let's get even more personalized
We recognize your account from another site in our network, please click 'Send Email' below to continue with verifying your account and setting a password.


Let's personalize your content