This site uses cookies to improve your experience. To help us insure we adhere to various privacy regulations, please select your country/region of residence. If you do not select a country, we will assume you are from the United States. Select your Cookie Settings or view our Privacy Policy and Terms of Use.
Cookie Settings
Cookies and similar technologies are used on this website for proper function of the website, for tracking performance analytics and for marketing purposes. We and some of our third-party providers may use cookie data for various purposes. Please review the cookie settings below and choose your preference.
Used for the proper function of the website
Used for monitoring website traffic and interactions
Cookie Settings
Cookies and similar technologies are used on this website for proper function of the website, for tracking performance analytics and for marketing purposes. We and some of our third-party providers may use cookie data for various purposes. Please review the cookie settings below and choose your preference.
Strictly Necessary: Used for the proper function of the website
Performance/Analytics: Used for monitoring website traffic and interactions
Data is a big buzzword across industries, but how about when it comes to logistics? William shares how they transform data into critical actionable information that optimizes and powers operations throughout businesses. Beyond The Data with William Sandoval. Our topic is beyond the data with my friend William Sandoval.
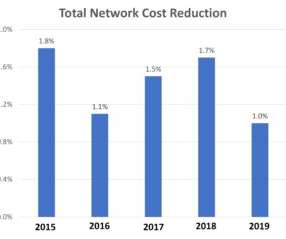
A single, centralized source of truth for your organizations data is no longer a luxuryits a necessity for businesses seeking to scale efficiently, enhance profitability, and make informed, data-driven decisions. This leads to: Inconsistent reporting: Different branches track data differently, making comparisons difficult.
Energy management solutions are products that energy utilities use to produce power and data centers use to consume power. They also produce industrial automation solutions that allow factories to monitor and control production. The supply chain has about 190 factories and 100 distribution centers.
Why Modern Data Warehouses Are No Longer Optional A centralized data warehouse is becoming an essential solution for businesses looking to scale efficiently and optimize operations. It’s no longer just a “nice to have,” but a critical repository for processing vast amounts of business data.
Manufacturers and distributors want to dramatically increase their efficiency, productivity and accuracy through smart technologies, data analytics and connected services. These terms are often used interchangeably, and yet understanding the difference is critical in the move toward smart factories powered by digital technologies.
To compete in this constantly changing market, manufacturers and distributors need more digital-driven services such as real-time production, tracking, and analysis. This means making factories smarter for the future. What is the smart factory? How to create a smart factory. It’s important to first to set objectives.
A practical way that manufacturers can do so is firstly through using data in more comprehensive ways and secondly by embracing digitization to optimize their operations for the future. Optimizing the use of data for manufacturers. Obstacles on the data journey for manufacturers.
Traditional supply chain planning, which relies on historical data and reactive adjustments, is no longer adequate for managing these challenges. Limitations of Traditional Supply Chain Planning Traditional supply chain planning relies on retrospective analysis.
The area of AI that manufacturers need to explore to drive their factories into the future is machine learning (ML). What is Machine Learning ML is the computing engine behind AI and gives computers the ability to make sense of, and learn, from data to perform specific tasks without manual interference. The Industry 4.0
By integrating Nauto’s AI-powered Video Event Data Recorder (VEDR) solution with Beans.ai’s precision location data and micro-routing technology, the collaboration offers a comprehensive solution tailored to meet the needs of last-mile deliveries, including VEDR compliance. Nauto and Beans.ai
We experience such diverse supply chain disruptions that tracking the data on U.S. The new problems stem from the recent port lockdowns, factory closures in Asia, a slow down in production, and mixed signals on U.S. The post Global Logistics Market Analysis: 2022 Summer Edition appeared first on More Than Shipping.
Supply chain leaders are enthralled with the idea of using big data, but they tend to fail to understand how to disseminate big data in their organization properly. True, they may know how to roll out big data in a single warehouse, or they may have heard their competitors used branded systems for implementing this new technology.
SICK UK unveiled its trailblazing SICK Augmented Reality Assistant (SARA) at Smart Factory Expo 2024 in Birmingham. The intuitive augmented reality app provides data visualization and error analysis by merging machine, sensor and diagnostic information with the real environment using technology most people carry in their pocket.
The United States Manufacturing Technology Orders (USMTO) data report is compiled monthly by the Association for Manufacturing Technology (AMT). What is the USMTO Data Report? The full data set is reported by eligible equipment builders and distributors and is provided to all participants in the program at no cost.
Products are ready in factories, but there are not enough containers for them. Based on Bloomberg’s data, container capacity shortages and port congestion have caused long-term rates to set in contracts between carriers and shippers to increase by almost 200% from a year ago. That’s why suppliers choose to send only urgent products.
Planners spend considerable time preparing scenario planning and not the actual analysis. For impactful scenario planning, planners must spend time on analysis rather than collating data and manually creating scenarios.
In Belcorp’s case they have four factories located in Colombia, Mexico, Peru, and Ecuador. Production flexibility is limited; none of these factories can make all the company’s 1,500 products. For consumers in metro areas located close to their factories, there is a one-day lead time. What factory should make a new product?
Due to the previous surge of China as the world’s factory over the last two decades, much of the global carriers’ business has revolved around transporting cargo between the U.S. And that’s why it’s important for carriers to apply data and enable predictive freight rating through these five requirements. Download the White Paper.
While American consumers went shopping, particularly online, the Asian factories and supply chains that produce the goods were broken due to labor and materials shortages. The NSAC is also working on a number of initiatives to improve the ports including: demurrage/detention standards, data standards, transparency, and digitization.
Machine learning (ML): Using algorithms and data to detect patterns without being explicitly programmed to do so automatically. ML and DL are mainly used in dataanalysis, classification, clustering, and ranking. GenAI systems are trained on massive amounts of text data to understand and generate human-like language.
Getting costs under control is important for a good return on capital investment and to ensure factory equipment is operating at optimum capacity and profitability. Modern machinery is commonly fitted with real-time sensors but these are not very useful if there is no way to view and action the data from the sensors.
More Resources Home August 14, 2024 Update The Freightos Weekly Update helps you stay on top of the latest developments in international freight by giving you the rundown on the latest economic data, ocean and air demand trends, rate data – and anything else impacting the market. Europe prices (FBX11 Weekly) fell 1% to $8,343/FEU.
At the end of 2019 that supply chain covered 38 PMI owned factories, 28 third party manufacturers, and more than 180 markets. Once the analysis was done for Year One set up, Year Two was pretty much the same. Analysis and scenario formulation lead time went from weeks to days. It was predictable.
Take a look at how the IoT supply chain is changing the landscape in terms of equipment functionality, shipping processes, invoicing and payments, and analysis of trends. Automated Data Transfers. In some cases, human intervention and input will be completely eliminated. IoT and Machine Functionality. Telecoms will also be significant.
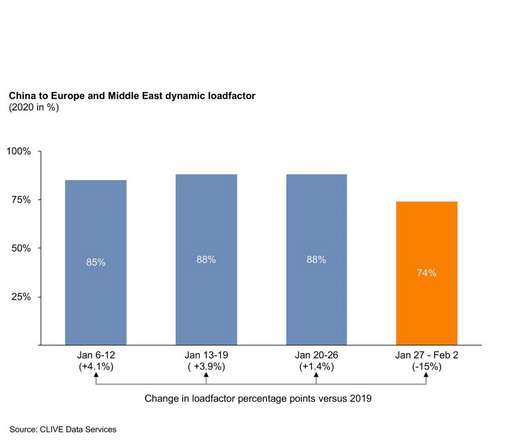
The global air cargo market saw a 4% year-on-year decline in the four weeks to February 2, 2020, according to the latest ‘dynamic load factor’ market intelligence from CLIVE Data Services. But looking at the data in more detail tells a more nuanced picture.
SYSPRO ’s 2020 survey, The Inflection Point for the Factory of the Future , showed that only about one-third (38%) of manufacturers’ business systems had enabled them to meet the challenges posed by the COVID-19 pandemic. Finance and production can’t be working off different data sets. The pandemic made that impossible.
That factory also aims to rapidly process the raw materials into product. An RFP is a data intensive exercise. This made the dataanalysis easier. On the inbound side, it was highly reliant on spreadsheet data. This made the dataanalysis “painful.” Then the clock starts ticking again.”
Planning applications don’t work well if the master data they rely on is not accurate; this is known as the “garbage in, garbage out” problem. Artificial intelligence is beginning to be used to update the data. Lead times, for example, are a critical form of master data for planning purposes.
Too much leads to resources being monopolised on gathering tons of data and a subsequent risk of “paralysis by analysis” Cost to Serve (CTS) is an approach that helps you avoid both extremes. If profits start to decline afterwards, your CTS data can offer valuable information about what changed and how to get back on track.
Those factories with essentially zero inventory of critical components were forced to close or drastically scale back. Utilize a TMS That provides real-time data to remain agile. Many companies rely on data that may lag several days. During a crisis, that’s entirely too late. Redesign your network.
The cargo volume at Shanghai port decreased significantly in April, as many factories closed, warehouses closed, and transportation options were limited. Although Shanghai remains largely locked down, some areas of the city may soon reopen as the Chinese government looks to jumpstart factory capacity after a lull.
While the short-term plans focus on safety stocks throughout the supply chain (in most cases, the priority to keep the factories fully operational remains). Use data to improve operations. To assist with the short-term solution, the answer is an extensive data-gathering exercise. The benefits of ERP.
Orders can be cancelled, rush orders come in, factory machines go down, port congestion occurs, and so forth. Aera is using data crawlers to crawl across billions of rows of transactional data on a monthly basis. This is combined with data from external sources on weather, logistics lead times, and sustainability performance.
For example, after the 2011 Thai floods, there was a global shortage of computer hard drives that sent consumer prices skyrocketing until factories were able to get back up and running. When the 2011 tsunami struck, several major car manufacturers were forced to shut down production at factories throughout Europe and the U.S.
However, remember that products or subassemblies that never made it out of the factory may need to travel backwards one or more stages along the supply chain. As market and buying trend data becomes more abundant and IT systems more connected, retailers can better estimate demand and adapt their ordering. Forecast demand better.
For manufacturers, low code tools can also be used to connect to other systems, such as an internet of Things (IoT) device to collect information from machines across the factory floor to improve efficiencies. It is also vital that your low code tool can connect with your ERP solution as a central point of data. Low code and ERP.
It’s evident from analyzing the thousands of global, on-site factory audits we’ve conducted so far this year that manufacturers’ interest in ethics and sustainability is waning. Ensuring safe working conditions is one of the major struggles, with its latest structural audit data pointing to slower progress than optimal. The bad news?
Shipping giant Maersk is out with a new warning: despite the Chinese economy staying resilient in the wake of the Covid pandemic, other factors such as a Chinese real estate market crash and repeating factory shutdowns in 2021 and 2022 have slowed down the Chinese economic recovery.
One of the big challenges facing manufacturers is inadequate reporting and analysis capabilities. This results in inefficient decision-making processes due to siloed data which limits the ability to respond to changing conditions quickly and accurately. Why companies invest in BI As a business grows, so does the amount of data.
Forensic profitability analysis for small and global businesses alike is available at a click with today’s supply chain software, as Paul Hamblin discovers. Because we had that, we could cross reference it to the P&L, we could cross-reference it to the billing data. is check that the data is accurate,” Aitken explains. “If
Data Becomes More Available and Accessible. Unfortunately, data quality was not always verifiable, but the IIoT ( Industry 4.0 ) is serving as a recent data capture point. As explained by Vin Vashista , the availability of data has become more readily embraced thanks to the IIoT. Preventive Maintenance in the Factory.
Svend Lassen, head of reporting & data analytics for commercial and supply chain at Tata Steel Europe, explained that there needs to be a clear understanding of how any digital project will improve margins before the project is approved. “We Planners come up with data-proven forecasts on what the market may buy.
In the long-run, using more technology can help create more jobs in these trades, as people are needed to help interpret data and create automation tasks. These technologies include: Big data; Augmented and virtual reality; Internet of things; Artificial intelligence. Field service companies can house a lot of data.
Pinart stressed that all three initiatives had enabled Nestlé to leverage AI, predictive maintenance and robotics to support factory automation and customization on the assembly line. By 2025, Nestlé aims to be fully data-driven and cognitive in its approach.
We organize all of the trending information in your field so you don't have to. Join 84,000+ users and stay up to date on the latest articles your peers are reading.
You know about us, now we want to get to know you!
Let's personalize your content
Let's get even more personalized
We recognize your account from another site in our network, please click 'Send Email' below to continue with verifying your account and setting a password.


Let's personalize your content