This site uses cookies to improve your experience. To help us insure we adhere to various privacy regulations, please select your country/region of residence. If you do not select a country, we will assume you are from the United States. Select your Cookie Settings or view our Privacy Policy and Terms of Use.
Cookie Settings
Cookies and similar technologies are used on this website for proper function of the website, for tracking performance analytics and for marketing purposes. We and some of our third-party providers may use cookie data for various purposes. Please review the cookie settings below and choose your preference.
Used for the proper function of the website
Used for monitoring website traffic and interactions
Cookie Settings
Cookies and similar technologies are used on this website for proper function of the website, for tracking performance analytics and for marketing purposes. We and some of our third-party providers may use cookie data for various purposes. Please review the cookie settings below and choose your preference.
Strictly Necessary: Used for the proper function of the website
Performance/Analytics: Used for monitoring website traffic and interactions
A freight spend analysis can help cut those extra costs. Performing a freight spend analysis reveals extra costs deriving from unforeseen issues. Let’s look at a few best practices and steps to conduct a comprehensive, insightful cost analysis. Know the scope and value of a freight spend analysis.
Data access and analysis continue to be essential to competitive operations within the process of monitoring rates and expenses in intermodal shipping lanes. Identifying current inbound and outbound rail volume rates in the current market. Predicted inbound and outbound fuel and maintenance budgeting needs. Request a SONAR Demo.
In this article, you learn what are the various reefer freight data indices available in SONAR, who in the freight market relies on these indices, what the indices tell freight market participants, and real-world scenario analysis of using SONAR refrigerated shipping indices to better understand the freight market.
For instance, using the trends and seasonality within the Outbound Tender Rejection Index, shown above , logistics coordinators can create responses to RFPs based on like a higher all-in rate. As highlighted by LinkedIn , a staggering 80% of bargaining is preparation, analysis, data review and planning before any meeting or discussion occurs.
Predictive data analysis allows managers to tweak and adjust route optimization and shipping protocols to accommodate market demands. The value of strategic planning and real-time data analysis cannot be overstated. Request your demos below. Request a SONAR Demo. Request a SONAR SCI Demo. Request a SONAR SCI Demo.
In the screenshot above, you can see that the outbound and inbound stability show scores of 29 out of 100 and 21 out of 100, respectively. harder to procure capacity at the benchmark rate per mile ) in both the outbound and inbound directions. Carriers will be able to see inbound and outbound stability on specific lanes.
Part of that strategy lies in using the right transportation data, analysis and insightful reports, such as those provided within FreightWaves SONAR, to guide day-to-day operations. Outbound/Inbound Tender Rejection Indices to understand market trends and rates. Request a SONAR demo online to learn more. Request a SONAR Demo.
Improved planning through wait time analysis benefits all parties. That includes compliance with the inbound freight routing guide and outbound activities. Learn how your company can use freight data analytics by getting a SONAR demo via the button below! Request a SONAR Demo. Things go wrong in supply chains.
The Stratford-upon-Avon based company, which was established in 2007 and recently won a Queen’s Award for Enterprise, is additionally enjoying consistent control of inventory and outbound processes, which help deliver a first-class customer experience. Their agile approach means giving clients select parts of the system (e.g.
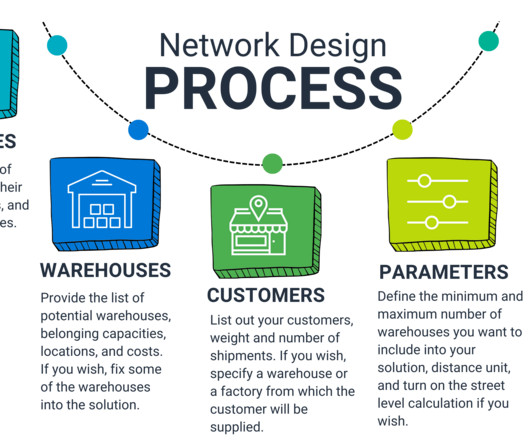
Handling rising transportation costs with Network Design Optimization Apps Within the Network Design App , we focus on optimizing the outbound process. The app provides a cost-optimal solution, emphasizing cost-based optimization for outbound activities. While mathematics is powerful, it may not always align with real-world scenarios.
Measuring capacity is a key to maximizing margins/transactions for a broker, utilization for a carrier, and minimizing service and budgetary failures for shippers.The capacity trend indices show you which markets are tightening or loosening by the largest amounts by combining tender rejection rates and market balance of inbound and outbound loads.
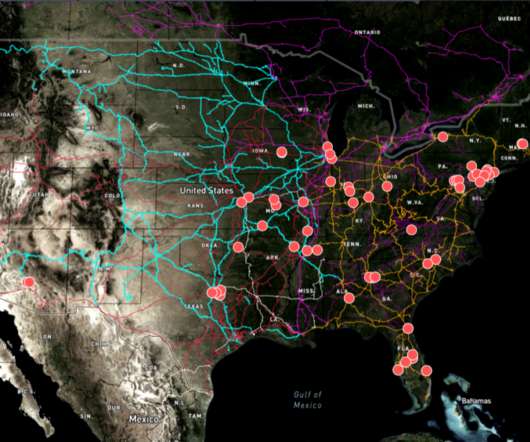
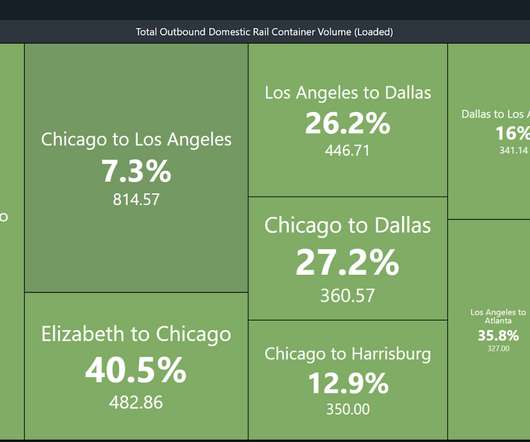
The data used in this analysis comes to FreightWaves from a transaction processor. . We conducted our analysis in this manner to protect the anonymity of the shippers while keeping the real-world complexities that exist in a freight network. . Most dry outbound Chicago shipments already move via rail intermodal. .
Are containers being transloaded into 53-foot dry vans and trucked from portside markets, or are the rails capturing more market share of outbound surface shipments to the inland markets around the U.S.? market, which has very limited outbound freight. SONAR data can identify tight relationships such as U.S.-bound Retail use case No.
One of the best ways to determine this is to request a demo from the vendor. After all, demos give you first-hand experience before you spend your money. So make sure you conduct a thorough analysis of the costs versus the benefits. You can get a free demo of the NetSuite software. Scalability. The best WMS for you will.
And lane-by-lane insights are critical to account for that disruption among raw material suppliers and the flow of outbound freight. Insight into market stability promotes increased transportation procurement and intervention when necessary Insight into the manufacturing supply chain market depends on lane-level analysis and response.
We organize all of the trending information in your field so you don't have to. Join 84,000+ users and stay up to date on the latest articles your peers are reading.
You know about us, now we want to get to know you!
Let's personalize your content
Let's get even more personalized
We recognize your account from another site in our network, please click 'Send Email' below to continue with verifying your account and setting a password.


Let's personalize your content