This site uses cookies to improve your experience. To help us insure we adhere to various privacy regulations, please select your country/region of residence. If you do not select a country, we will assume you are from the United States. Select your Cookie Settings or view our Privacy Policy and Terms of Use.
Cookie Settings
Cookies and similar technologies are used on this website for proper function of the website, for tracking performance analytics and for marketing purposes. We and some of our third-party providers may use cookie data for various purposes. Please review the cookie settings below and choose your preference.
Used for the proper function of the website
Used for monitoring website traffic and interactions
Cookie Settings
Cookies and similar technologies are used on this website for proper function of the website, for tracking performance analytics and for marketing purposes. We and some of our third-party providers may use cookie data for various purposes. Please review the cookie settings below and choose your preference.
Strictly Necessary: Used for the proper function of the website
Performance/Analytics: Used for monitoring website traffic and interactions
Kevin is the Vice President of Sales at Greenscreens.ai , a technology that provides predictive pricing recommendations for maximum broker margins. is a pricing platform specifically tailored for the truckload spot freight market. offers real-time market price predictions that take into account the buying power of your company.
Flexibility in a Volatile Market: As pricing and freight capacity fluctuate, procurement professionals need to adjust rates quickly without lengthy RFP processes. Partnership-First Approach: By eliminating the burden of frequent, large-scale tenders, shippers preserve key relationships with providers, ensuring collaboration over competition.
billion rate data points monthly to provide the most comprehensive view of the market, helping you identify savings opportunities and make data-driven decisions. billion rate data points monthly to provide the most comprehensive view of the market, helping you identify savings opportunities and make data-driven decisions.
Adjusting current logistics strategies demonstrated the second great challenge of the pandemic. Embracing new and improved logistics strategies remains the best way to adapt to clients’ changing demands in 2021 and beyond. Now more than ever, shippers need to find innovative ways to make the most of real-time freight data and analysis.
From a financial standpoint, transportation cost analysis remains focused on determining the value of the resources used to execute a given shipment and goes well beyond benchmarking. Moreover, this kind of analysis does not focus on who ends up paying which expenses in the end. The challenges of limited transportation cost analysis.
Judah Levine October 15, 2024 Weekly highlights Ocean Rates – Freightos Baltic Index Asia-US West Coast prices (FBX01 Weekly) fell 3% to $5,565/FEU. Asia-US East Coast prices (FBX03 Weekly) climbed 1% to $6,787/FEU. Europe prices (FBX11 Weekly) fell 11% to $3,625/FEU. America weekly prices decreased 23% to $5.43/kg.
Inventory Replenishment Strategies to Boost Profitability. To overcome all these inventory management risks, you need a toolbox of effective inventory replenishment strategies. 5 Inventory Replenishment Strategies to Increase Profits. Any business that carries inventory needs to avoid stockouts and back orders.
We will discuss case studies, future trends, and guidelines for businesses considering whether to invest in this cutting-edge technology. This proactive approach reduces the reliance on intensive control measures, allowing for more efficient pest management strategies.
Judah Levine Optimize your logistics tendering, vendor selection, negotiations, and procurement Book a Demo Weekly highlights Ocean rates – Freightos Baltic Index Asia-US West Coast prices (FBX01 Weekly) increased 3% to $1,609/FEU. Asia-US East Coast prices (FBX03 Weekly) climbed 7% to $2,357/FEU. kg China – N.
Judah Levine November 15, 2023 Optimize your logistics tendering, vendor selection, negotiations, and procurement with Freightos Data Book a Demo Weekly highlights Ocean rates – Freightos Baltic Index Asia-US West Coast prices (FBX01 Weekly) increased 6% to $1,711/FEU. Europe prices (FBX11 Weekly) increased 11% to $1,381/FEU.
This feature is particularly beneficial for LSPs preparing tenders or tariff proposals, as it provides a structured approach to pricing. To see our Matrix Creator App in action, click on the image and explore the interactive demo. Minimum Travel Time Optimize routes to reduce time spent on the road.
For managers in the transportation industry, freight load pricing accuracy remains a source of confusion and disruption. The best and only successful way to overcome flawed data analysis is to use effective technology. Making the most of freight management and data analysis services will represent a key focus in the years ahead.
Judah Levine November 28, 2023 Optimize your logistics tendering, vendor selection, negotiations, and procurement with Freightos Data Book a Demo Weekly highlights Ocean rates – Freightos Baltic Index Asia-US West Coast prices (FBX01 Weekly) increased 3% to $1,613/FEU. Europe prices (FBX11 Weekly) fell 6% to $1,211/FEU.
billion rate data points monthly to provide the most comprehensive view of the market, helping you identify savings opportunities and make data-driven decisions. billion rate data points monthly to provide the most comprehensive view of the market, helping you identify savings opportunities and make data-driven decisions.
April 29, 2025 Blog Weekly highlights Ocean rates – Freightos Baltic Index Asia-US West Coast prices (FBX01 Weekly) fell 1% to $2,328/FEU. Asia-US East Coast prices (FBX03 Weekly) fell 2% to $3,395/FEU. Europe prices (FBX11 Weekly) stayed level at $2,337/FEU. America weekly prices increased 1% to $5.58/kg.
Fuel costs: Last-mile fuel costs require careful management as they make up 25% of a truck’s operational costs over volatile price fluctuations. A recent analysis by the American Trucking Associations (ATA) indicates that if existing trends persist, we could see a potential driver shortage reaching up to 175,000 by 2024.
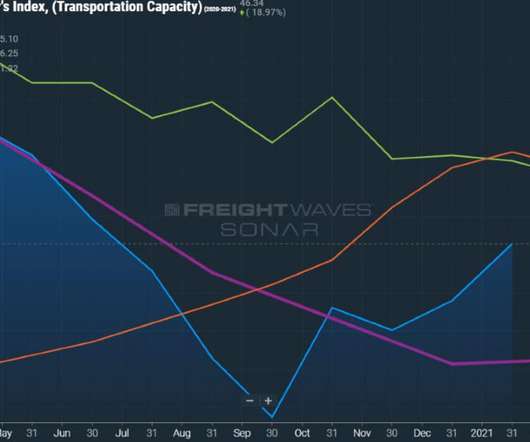
Yes, the need for shipping demand analytics is not new and was echoed in 2013 by Industry Week , “Relying on traditional supply chain execution systems is becoming increasingly more difficult, with a mix of global operating systems, pricing pressures and ever-increasing customer expectations. Request a SONAR Demo.
There’s a broad range of options to reduce rates and increase carrier revenue. Track truckload freight accessorial costs As reported by Inbound Logistics , “Carriers price accessorials, such as liftgate or non-commercial delivery, at a premium. Review transportation pricing and contracts regularly.
Judah Levine December 6, 2023 Optimize your logistics tendering, vendor selection, negotiations, and procurement with Freightos Data Book a Demo Weekly highlights Ocean rates – Freightos Baltic Index Asia-US West Coast prices (FBX01 Weekly) were level at $1,620/FEU. Europe prices (FBX11 Weekly) increased 3% to $1,243/FEU.
They tend to follow similar lines and influence services and prices throughout transportation networks. According to Supply Chain 24/7 , “ truckload service optimizes trailer space and moves freight [without extra stops that will] eliminate wasted trips, reducing greenhouse gas emissions by up to 40%.”
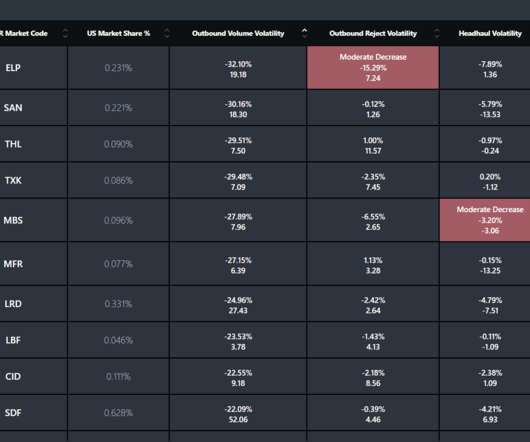
Tracking market trends within truckload rates relies heavily on data and analysis. The key to avoiding this kind of situation is predictive planning and analysis. This kind of real-time data analysis and application is essential for shippers to stay strategic and tactical as they forecast out contract and spot truckload rates.
Judah Levine November 21, 2023 Optimize your logistics tendering, vendor selection, negotiations, and procurement with Freightos Data Book a Demo Weekly highlights Ocean rates – Freightos Baltic Index Asia-US West Coast prices (FBX01 Weekly) decreased 8% to $1,573/FEU. Europe prices (FBX11 Weekly) decreased 7% to $1,291/FEU.
Judah Levine November 19, 2024 Get Started Weekly highlights Ocean Rates – Freightos Baltic Index Asia-US West Coast prices (FBX01 Weekly) increased 3% to $5,345/FEU. Asia-US East Coast prices (FBX03 Weekly) fell 1% to $5,395/FEU. Europe prices (FBX11 Weekly) increased 2% to $4,580/FEU. kg China – N.
Judah Levine December 13, 2023 Optimize your logistics tendering, vendor selection, negotiations, and procurement with Freightos Data Book a Demo Weekly highlights Ocean rates – Freightos Baltic Index Asia-US West Coast prices (FBX01 Weekly) fell 1% to $1,603/FEU. Asia-US East Coast prices (FBX03 Weekly) climbed 5% to $2,497/FEU.
Air Cargo Rates at Pre-Pandemic Lows Air cargo rates are nearing early 2020 levels, signaling a potential return to pre-pandemic pricing structures. A decline in business travel has reduced belly capacity on passenger flights, while booming e-commerce demand had previously propped up air freight rates. However, U.S.
Transportation spending is a perennial target of budget-cutting exercises, and a large, multi-faceted cost center for many companies; some may spend three to six percent of their materials costs on transportation. Accurate transportatin data is likely the single most important factor in a sustainable cost reduction plan.
Supply chain leaders continue to focus their efforts on finding the right mix of assets used, market positioning and carrier freight pricingstrategies. When the freight market meets expectations and is less volatile, it is easy for shippers and carriers to not look at inefficient processes or their transportation procurement strategy.
Judah Levine July 16, 2024 Weekly highlights Ocean rates – Freightos Baltic Index Asia-US West Coast prices (FBX01 Weekly) increased 2% to $8,101/FEU. Asia-US East Coast prices(FBX03 Weekly) climbed 9% to $9,620/FEU. Europe prices(FBX11 Weekly) increased 3% to $8,632/FEU. America weekly prices stayed level at $5.57/kg
Judah Levine April 16, 2024 Weekly highlights Ocean rates – Freightos Baltic Index Asia-US West Coast prices (FBX01 Weekly) were level at $3,288/FEU. Asia-US East Coast prices(FBX03 Weekly) fell 1% to $4,276/FEU. Europe prices(FBX11 Weekly) increased 7% to $3,545/FEU. America weekly prices increased 69% to $6.17/kg
But they don’t so much win them on service – they win on price (that’s something that Freightos research actually showed too). That’s good for the big customers – the Starbucks, Walmarts and Apples, who demand (and get) business class service for an economy price ticket. REQUEST A FREIGHTOS DEMO. But It’s About To Change.
Judah Levine June 11, 2024 Weekly highlights Ocean rates – Freightos Baltic Index Asia-US West Coast prices (FBX01 Weekly) increased 17% to $5,888/FEU. Asia-US East Coast prices (FBX03 Weekly) climbed 12% to $7,516/FEU. Europe prices (FBX11 Weekly) increased 23% to $6,163/FEU. Europe weekly prices fell 12% to $3.40/kg.
Carriers simply need to know where to send trucks and the proper freight rating or pricingstrategies to use. That will go a long way in reducing operating ratios and increasing fleet utilization. Carriers need an advanced dashboard that puts the information front and center, creating an intuitive pricing process.
Judah Levine January 10, 2024 Optimize your logistics tendering, vendor selection, negotiations, and procurement with Freightos Data Book a Demo Weekly highlights Ocean rates – Freightos Baltic Index Asia-US West Coast prices (FBX01 Weekly) increased 60% to $2,713/FEU. Europe prices (FBX11 Weekly) increased 176% to $4,391/FEU.
Let’s delve into this topic to understand its significance and explore strategies for optimizing delivery routes to enhance customer satisfaction. By minimizing fuel consumption, reducing vehicle wear and tear, and optimizing driver schedules, businesses can cut down on operational costs associated with logistics.
Judah Levine October 8, 2024 Weekly highlights Ocean Rates – Freightos Baltic Index Asia-US West Coast prices (FBX01 Weekly) fell 15% to $5,760/FEU. Asia-US East Coast prices (FBX03 Weekly) fell 22% to $6,744/FEU. Europe prices (FBX11 Weekly) fell 20% to $4,075/FEU. America weekly prices increased 20% to $7.07/kg.
Efficient inventory management, layout organization, and operational strategies are key to meeting customer demands while minimizing costs and maximizing profits. One of the most powerful tools employed in this endeavor is the ABCD Analysis.
May 28, 2024 Weekly highlights Ocean rates – Freightos Baltic Index Asia-US West Coast prices (FBX01 Weekly) increased 13% to $4,917/FEU. Asia-US East Coast prices (FBX03 Weekly) climbed 18% to $6,323/FEU. Europe prices (FBX11 Weekly) climbed 6% to $4,876/FEU. America weekly prices decreased 3% to $5.69/kg.
7 min read Maximizing Warehouse Efficiency: Unleashing the Potential of ABCD Analysis In the dynamic world of supply chain management, optimizing warehouse operations has become an indispensable factor for businesses. One of the most powerful tools employed in this endeavor is the ABCD Analysis.
Judah Levine May 15, 2024 Weekly highlights Ocean rates – Freightos Baltic Index Asia-US West Coast prices (FBX01 Weekly) increased 14% to $3,873/FEU. Asia-US East Coast prices (FBX03 Weekly) climbed 8% to $5,093/FEU. Europe prices(FBX11 Weekly) increased 17% to $4,151/FEU. America weekly prices increased 8% to $5.86/kg.
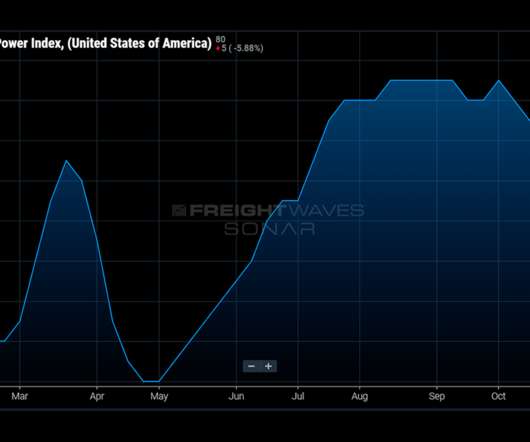
This week, learn how freight market participants are able to measure if freight pricing control lays in the hands of freight shippers or freight carriers. What is the DHL Supply Chain Pricing Power Index? The chart above has an 80 reading which indicates that the control of freight pricing lies in the carriers’ hands.
Judah Levine February 22, 2024 Optimize your logistics tendering, vendor selection, negotiations, and procurement with Freightos Data Book a Demo Weekly highlights Ocean rates – Freightos Baltic Index Asia-US West Coast prices (FBX01 Weekly) increased 1% to $4,889/FEU. Europe prices (FBX11 Weekly) fell 2% to $4,587/FEU.
Judah Levine August 27, 2024 Weekly highlights Ocean Rates – Freightos Baltic Index Asia-US West Coast prices (FBX01 Weekly) increased 11% to $7,115/FEU. Asia-US East Coast prices (FBX03 Weekly) climbed 3% to $9,698/FEU. Europe prices (FBX11 Weekly) fell 4% to $7,965/FEU. America weekly prices increased 15% to $6.12/kg.
This approach is cumbersome and fraught with challenges such as limited visibility, inefficient data management and difficulties in bid analysis. Centralization and Standardization These platforms centralize procurement tasks, reducing the reliance on multiple spreadsheets and allowing for a more organized approach to managing bids.
Studying competitors is an integral part of market research as it helps the medical courier business gain insights into their strengths, weaknesses, and overall strategies. RouteManager’s last-mile delivery software helps you cut fuel costs, increase revenue, and improve operations. GET A FREE DEMO 2. Start Using RouteManager!
We organize all of the trending information in your field so you don't have to. Join 84,000+ users and stay up to date on the latest articles your peers are reading.
You know about us, now we want to get to know you!
Let's personalize your content
Let's get even more personalized
We recognize your account from another site in our network, please click 'Send Email' below to continue with verifying your account and setting a password.


Let's personalize your content