This site uses cookies to improve your experience. To help us insure we adhere to various privacy regulations, please select your country/region of residence. If you do not select a country, we will assume you are from the United States. Select your Cookie Settings or view our Privacy Policy and Terms of Use.
Cookie Settings
Cookies and similar technologies are used on this website for proper function of the website, for tracking performance analytics and for marketing purposes. We and some of our third-party providers may use cookie data for various purposes. Please review the cookie settings below and choose your preference.
Used for the proper function of the website
Used for monitoring website traffic and interactions
Cookie Settings
Cookies and similar technologies are used on this website for proper function of the website, for tracking performance analytics and for marketing purposes. We and some of our third-party providers may use cookie data for various purposes. Please review the cookie settings below and choose your preference.
Strictly Necessary: Used for the proper function of the website
Performance/Analytics: Used for monitoring website traffic and interactions
GET A FREE DEMO The Role of Data Analytics Data analytics plays a vital role in last-mile delivery route optimization. By harnessing data from various sources, businesses can gain insights into customer preferences, peak delivery times, and route efficiency. Schedule a demo with RouteManager today to see the benefits for yourself!
A freight spend analysis can help cut those extra costs. Performing a freight spend analysis reveals extra costs deriving from unforeseen issues. Let’s look at a few best practices and steps to conduct a comprehensive, insightful cost analysis. Know the scope and value of a freight spend analysis.
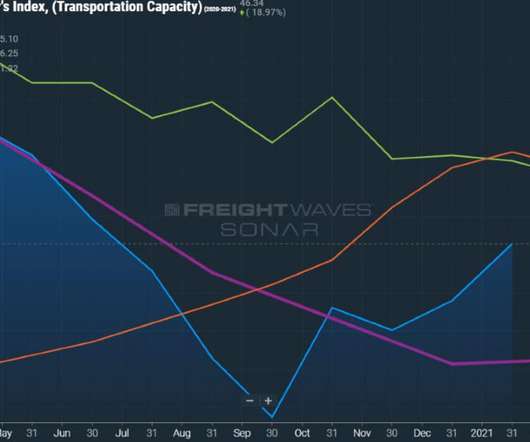
Tracking market trends within truckload rates relies heavily on data and analysis. The key to avoiding this kind of situation is predictive planning and analysis. This kind of real-time data analysis and application is essential for shippers to stay strategic and tactical as they forecast out contract and spot truckload rates.
The intuitive augmented reality app provides data visualization and error analysis by merging machine, sensor and diagnostic information with the real environment using technology most people carry in their pocket. SICK UK unveiled its trailblazing SICK Augmented Reality Assistant (SARA) at Smart Factory Expo 2024 in Birmingham.
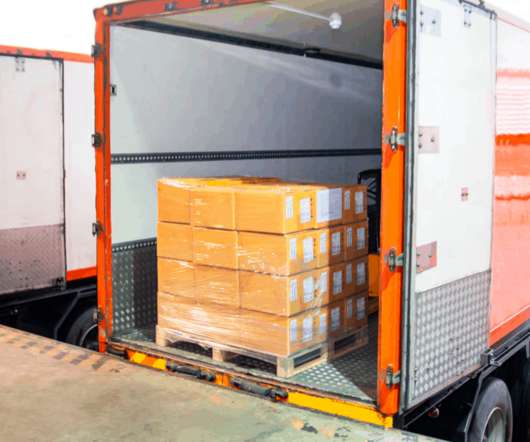
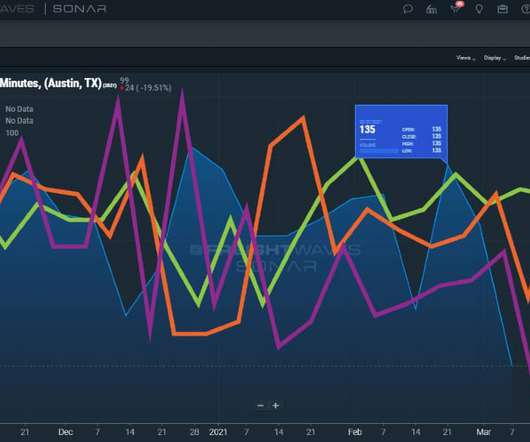
The problem: Shipping demand management includes a need to source capacity around the clock Capacity rules when it comes to keeping the supply chain moving and the trucks full. Sourcing capacity and load contracts require the constant attention of management. Request a FreightWaves SONAR demo today by clicking the button below.
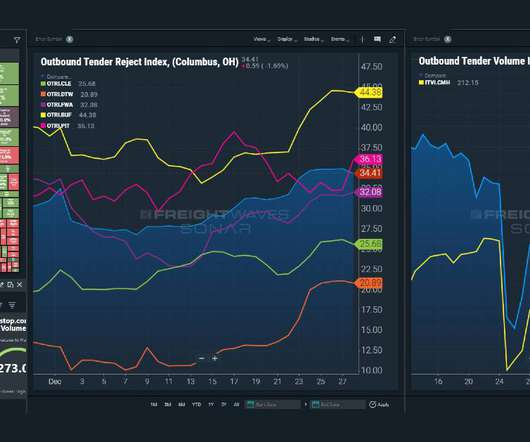
Routing guides are a universal source of carrier freight tendering and action. In other words, a lack of insight into market-by-market and lane-by-lane analysis will amount to trouble in understanding what is going wrong and what is necessary to improve service levels. Request a SONAR Demo. Request a SONAR SCI Demo.
For managers in the transportation industry, freight load pricing accuracy remains a source of confusion and disruption. The best and only successful way to overcome flawed data analysis is to use effective technology. Making the most of freight management and data analysis services will represent a key focus in the years ahead.
Meanwhile, an API would have ensured the data was accurate and identical to the original source. . It all depends on the quality of the data source. Relying on manual analysis is like using messenger pigeons in an age of web conferencing, email, and single-click mass communication. Request a SONAR Demo.
This approach is cumbersome and fraught with challenges such as limited visibility, inefficient data management and difficulties in bid analysis. Access to data from reputable sources like SONAR allows shippers to assess the appropriateness of carrier bids more effectively and make better-informed decisions.
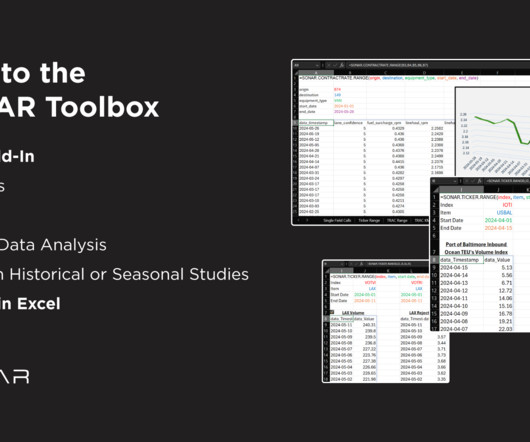
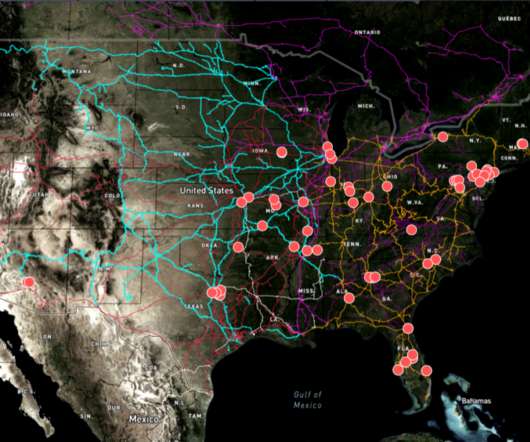
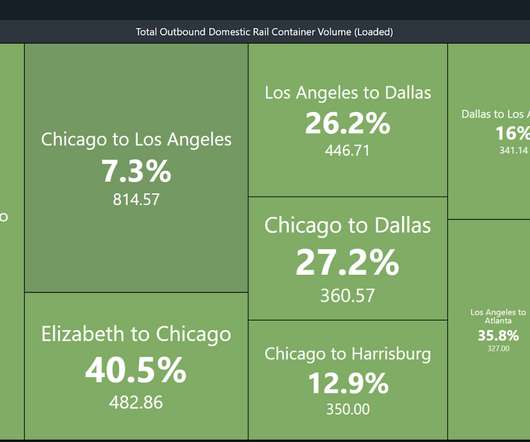
Excel analysis of the new SONAR tool shows how truckload competes with rail intermodal by lane Prior to last month, SONAR data was available in two ways: by using the browser-based visualization tool or via an API connection. Source: SONAR I selected the 15 lanes with the greatest domestic intermodal density, starting with LA to Chicago.
The TMS used should be capable of handling various aspects of transport management including needs assessment, effective analysis, integration and management in addition to providing you visibility on inbound products, receiving, storing and distribution. MY.SHIPPING.
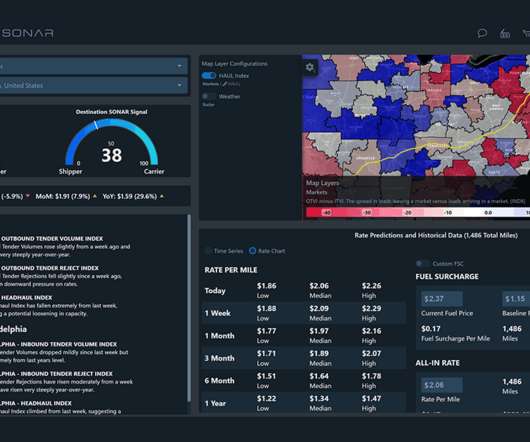
Part of that strategy lies in using the right transportation data, analysis and insightful reports, such as those provided within FreightWaves SONAR, to guide day-to-day operations. Having access to that granular data is critical to getting the best loads, sourcing the most competitive capacity, and delivering value as a broker. .
Access to data and proper analysis are both essential to maximize profits and reduce costs. There are many ways for shippers to take advantage of technology and advancements within the industry, but three key methods are essential for utilizing trucking data to source capacity. Request a SONAR Demo. trillion in 2018.
In addition to providing a reliable source of revenue, these partnerships can yield valuable leads and encourage the sharing of contact information with community members. Understanding your sources’ value enables companies to measure ROI from all marketing efforts, ensuring effective resource allocation and aligned strategies.
Another way to source new vendors due to changing availability is to look for opportunities to form long-term relationships with partners. Digital analysis and detail-oriented recordkeeping of all mode activities, including ocean import data , makes it easy to enhance overall performance. . Request a SONAR Demo.
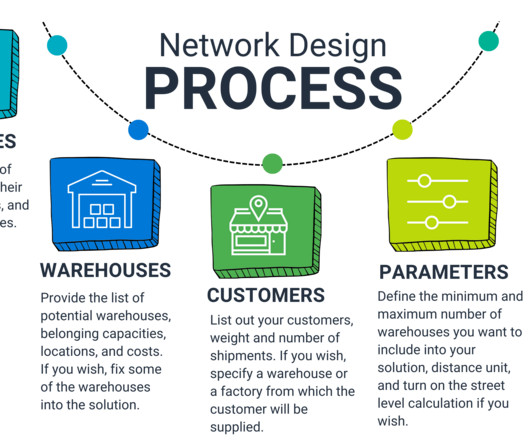
This tool makes it easy to create custom, clear maps that visualize your supply chain while enabling global reachability analysis and street-level distance calculations. NETWORK DESIGN The apps from the Network Design category enable powerful analysis and scenario simulations for cost-optimal network design and goods flow.
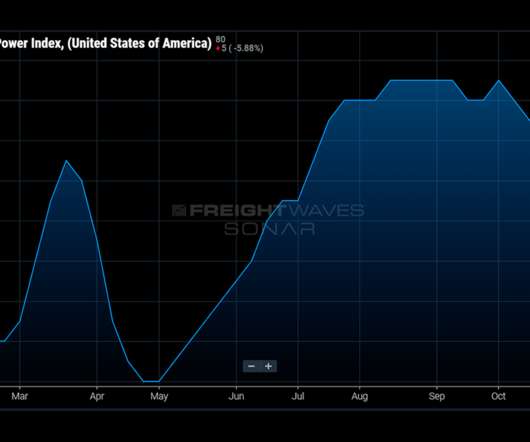
The DHL Supply Chain Power Pricing Index (DHLPPI.USA) is a weekly analysis produced by the FreightWaves Freight Intel Group using freight data and freight analytics in SONAR and other sources to estimate the current pricing power dynamics between shippers and carriers. Request a SONAR Demo.
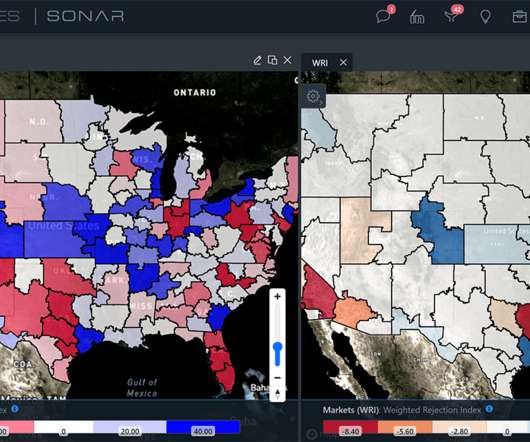
In this article, you learn what are the various reefer freight data indices available in SONAR, who in the freight market relies on these indices, what the indices tell freight market participants, and real-world scenario analysis of using SONAR refrigerated shipping indices to better understand the freight market. Request a SONAR Demo.
Source: Amazon patent. Here are some details from the press release: With Haven TMS, Haven evolves from a logistics quote marketplace into a full-featured transportation management system (TMS) with collaboration, procurement, and analysis modules. I haven’t seen a demo of the solution, so I can’t comment on its functionality.
That includes sourcing raw materials, production facilities’ dock scheduling, warehousing considerations, and customer service through last-mile logistics. Reap the rewards of insightful freight data analytics with FreightWaves SONAR at your fingertips The only way forward in logistics lies in the careful analysis of transportation data.
Source: SONAR, To learn more about FreightWaves SONAR, click here. ). Source: FreightWaves data, To learn more about FreightWaves SONAR, click here. ). The data used in this analysis comes to FreightWaves from a transaction processor. . Source: FreightWaves data, To learn more about FreightWaves SONAR, click here. ) .
Having access to real-time data and having shipping technology systems that allow for fast analysis is vital. However, it all lacks value without a single source of truth for freight data forecasting to benchmark, analyze, monitor and forecast expectations. Request your FreightWaves SONAR demo here or by clicking the button below.
We presume you’re familiar with the locations of your customers and factories, considering factories as your sources or suppliers. Explore Supply Chain Apps Our Team is always open to providing you with a custom demo, covering the topics you wish, and showcasing the possibilities of our solutions based on your use case.
But as the number of systems being used increases, the amount of data available for consumption and analysis grows exponentially. Inventory management information usually comes from a variety of data sources and is either structured or unstructured. Introducing big data analysis into your business.
Cooking demos were piloted in Doa district in 2019, as a complement to the findings of the WFP-led nutrition analysis Fill the Nutrient Gap Mozambique published in 2018?—?it The analysis found that fresh foods, delivered through cash-based-transfers rather than in-kind assistance, would reduce costs of a nutritious diet. “One
Sustainability Pressures: As the importance of sustainability increases, supply chain managers need to consider environmental impacts and ethical sourcing, which can be very complex. Data-driven Decision-making : Visualization tools aggregate and present data from various sources in a unified manner.
Sustainability Pressures: As the importance of sustainability increases, supply chain managers need to consider environmental impacts and ethical sourcing, which can be very complex. Data-driven Decision-making : Visualization tools aggregate and present data from various sources in a unified manner.
For more information, feel free to contact us or schedule a demo of RouteManager to see how our solutions can help address driver availability challenges. We aim to proactively empower businesses to better navigate the complexities of modern logistics while offering innovative solutions.
These networks allow for greater flexibility in sourcing, increased negotiation power, and continuous improvement initiatives. These systems can collect and analyze vast amounts of data from various sources, enabling businesses to make data-driven decisions. Book a demo today! Get Started With ServMan Software!
Logistics management involves the efficient and effective coordination of various tasks related to the transportation, storage, and delivery of goods, services, and information starting from the source to the end-users. Source: Zebra Technologies). between 2020 and 2027. Talk to our experts now!
Green waste , mainly organic materials such as grass clippings, branches, and leaves, can be composted or turned into a renewable energy source. Banks often require a detailed analysis of the business and its potential revenue streams before considering providing loans. GET A FREE DEMO 5. Book a demo today!
What We Learned So Far With the numbers in, we gathered findings from multiple sources to suss out the shiniest nuggets of wisdom. Mature ecommerce businesses use every source of data they can get their hands on, from shopping platform analytics to inventory and fulfillment platforms. Interest rates have not been this high since 2007.
Considering every phase in the supply chain, such as sourcing goods, logistics and delivery, the strategy optimizes operations to reduce costs and maximize profits. This will provide maximum analysis and understanding of your current setup and support sales and operations planning.
When demand forecasting, ensure you consider demand variables, such as seasonality , trends and qualitative information sources to make them as accurate as possible. If you have inventory management problems that you’d like to discuss with our team, or you’d like a demo of EazyStock software, please get in touch.
With hundreds of demos and hands-on labs, plus exhibitions from more than 250 partners and customers from around the world, Oracle OpenWorld has become a showcase for leading cloud technologies, from Cloud Applications to Cloud Platform and Infrastructure. Secondly, there’s Non-disputable root-cause analysis. Jewell: Exactly.
Supply chain managers gain the ability to make strategic decisions backed by data-driven analysis, improving overall efficiency and responsiveness. For a closer look at this process, check out the embedded demo. The app generates detailed reports and insights, enabling informed decision-making.
Overall & Analysis. However, software bots can instantly identify a quote request, even in email, review data sources, and upload the quote for a quick solution. Request a demo with RPA Labs to get started. The average response time of those who responded was sixty hours.
However, the more information you request within an RFQ, the more complex the analysis of the results will turn out. With a sophisticated e-sourcing tool, expressive bidding projects can be easily created and evaluated automatically. Thanks to modern technologies, the digital trend toward self-empowerment also applies here.
You may hear “from sources overseas” that volumes have reached an all-time high, but having an objective third-party source that can confirm what you may suspect as “hearsay” provides you with the additional, actionable insight and confidence you need to drive key decisions for your supply chain. Source: FreightWaves SCI).
One way to do this is with ABC/XYZ analysis. One way is to pass these increases on to your customers to reduce the need to source more capital. You might want to consider non-traditional sources of capital, such as supply chain finance solutions. How can you manage these higher costs?
With Locus’ dispatch management software , your stakeholders can quickly source on-ground data and delivery metrics to evaluate delivery performance. Schedule a Demo References: [link] [link] [link] [link] The post 5 Signs You Need Advanced Supply Chain Analytics to Make Better Last-Mile Decisions appeared first on Locus Blog.
Digital freight matching is growing more valuable as a way to source meaningful capacity Companies and freight managers that have embraced digital technology and automation remain more likely to thrive. Throughout the years to come, accurate data analysis will remain essential for effective truckload shipping. Request a SONAR Demo.
Weather issues and delays continue to be the most common source of fluctuation and disturbance to the modern supply chain. Insight into market stability promotes increased transportation procurement and intervention when necessary Insight into the manufacturing supply chain market depends on lane-level analysis and response.
Improved predictive analysis and projection with logistics automation data and insights. Logistics automation and real-time data analysis make this kind of insight possible. Real-time data, automated analysis and data-sharing remain essential to continued success and growth for all enterprise shippers. Request a SONAR Demo.
We organize all of the trending information in your field so you don't have to. Join 84,000+ users and stay up to date on the latest articles your peers are reading.
You know about us, now we want to get to know you!
Let's personalize your content
Let's get even more personalized
We recognize your account from another site in our network, please click 'Send Email' below to continue with verifying your account and setting a password.


Let's personalize your content