This site uses cookies to improve your experience. To help us insure we adhere to various privacy regulations, please select your country/region of residence. If you do not select a country, we will assume you are from the United States. Select your Cookie Settings or view our Privacy Policy and Terms of Use.
Cookie Settings
Cookies and similar technologies are used on this website for proper function of the website, for tracking performance analytics and for marketing purposes. We and some of our third-party providers may use cookie data for various purposes. Please review the cookie settings below and choose your preference.
Used for the proper function of the website
Used for monitoring website traffic and interactions
Cookie Settings
Cookies and similar technologies are used on this website for proper function of the website, for tracking performance analytics and for marketing purposes. We and some of our third-party providers may use cookie data for various purposes. Please review the cookie settings below and choose your preference.
Strictly Necessary: Used for the proper function of the website
Performance/Analytics: Used for monitoring website traffic and interactions
From a financial standpoint, transportation cost analysis remains focused on determining the value of the resources used to execute a given shipment and goes well beyond benchmarking. Moreover, this kind of analysis does not focus on who ends up paying which expenses in the end. The challenges of limited transportation cost analysis.
Truck fleet management has always been intensely focused on knowledge of the freight market. By using strong management and analysis processes, supply chains can maximize value and stay competitive. A clear vision for how the market and the fleet can work in unison is at the heart of fleet management within the trucking industry.
Trucking capacity is tight, and deadheading is the precursor of even stricter capacity. The problem of deadheading in trucking. By utilizing effective trucking RFP protocols, freight managers can ensure trucks stay filled on every leg of every trip. The best way to avoid deadheading is by on-demand freight data analysis.
With that in mind, the trucking RFP has come into play as a more significant undertaking for 2021 contracts as the freight market saw volatility in 2020 on the spot market due to historic tender rejections and volumes adding to increased prices. A confident, data-driven trucking RFP undertaking can make a big difference in freight spend.
That’s the onus of electronic freight tender trucking data when compared to lagging submitted data that may take 7 to 14 days to come in. Near-real time freight electronic tender trucking data offers reliable insights. Now imagine the value of more accurate data in light of the pandemic. Download the White Paper.
Many asset-based carriers utilize freight broker and data technology to recruit truck drivers and reel in new talent. Recruiting truck drivers is not only the top challenge for carriers, but it will always remain one of the highest priorities. The truck driver shortage and its relationship to the capacity crunch.
A freight spend analysis can help cut those extra costs. Performing a freight spend analysis reveals extra costs deriving from unforeseen issues. Let’s look at a few best practices and steps to conduct a comprehensive, insightful cost analysis. Know the scope and value of a freight spend analysis.
Now more than ever, shippers need to find innovative ways to make the most of real-time freight data and analysis. Logistics strategies will leverage expert insight The best enterprise shippers look for ways to improve trucking costs and operations with big data applications. Request a SONAR Demo. Download the White Paper.
Market Analysis Understanding your market is crucial for any business. Competitive Analysis : Who are your competitors? You may also include a brief description of the equipment or vehicles you’ll use, such as vans, trucks, or bicycles. local businesses, healthcare, e-commerce companies) Key differentiators (e.g., through 2027.
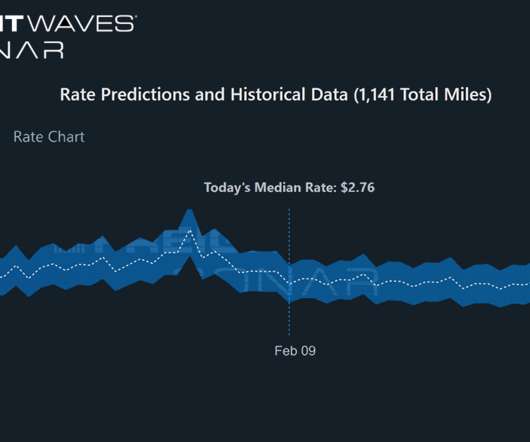
Freight and trucking data makes for an excellent resource for shippers and logistic service providers (LSPs) alike. The data obtained from historical and contract load tender information creates a valuable tool – a trucking rate predictor. Why lagging data contributes to limited insight into trucking rates.
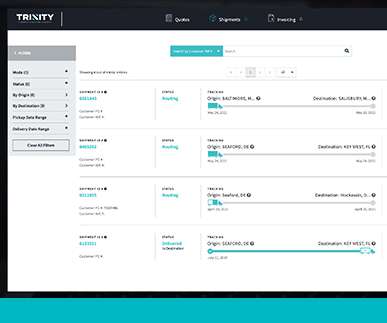
It can be common for several different shipments to be in transit aboard different company trucks and all over the country/world. GET MY FREE SUPPLY CHAIN ANALYSIS. Schedule a risk-free live demo with Ryan O’Halloran to learn more about our customizable solutions. SCHEDULE A RISK-FREE LIVE DEMO.
The trucking market is volati le. Gaining objectivity in the trucking market. With the most comprehensive freight data and analysis in history, most of which is updating every 24 hours, SONAR has the data, tools and potential to provide objectivity to the logistics market as a whole, offering users much-needed protection.
And the transportation and shipping industry has a choice to make – to take advantage of trucking data or to ignore it, continuing as before. . Access to data and proper analysis are both essential to maximize profits and reduce costs. Real-time trucking data helps to secure more capacity and better shipping rates.
Data access and analysis continue to be essential to competitive operations within the process of monitoring rates and expenses in intermodal shipping lanes. And if the ramp is too far, it may be a better move to account for and plan a long-haul trucking route. Request a SONAR Demo.
Smart and practical trucking data is critical for the modern supply chain network. The top four types of trucking carriers include: Strategic Partners – These carrier providers make up most shippers’ primary focus and handle the bulk of day-to-day loads. Fuel costs money to move the fleet; trucks need to stay full on the road.
Control over trucking freight rating remains a blip for many carriers, particularly owner-operators and those trying to manage the chaos of a pandemic-stressed industry. Quite simply, freight rating challenges are not a problem limited to trucking carriers. Now, the industry is changing yet again.
Being able to secure loads and maintain long-term shipping contracts is essential to keeping trucks full and keeping the fleet on the road. When trucks make return trips empty, it often ends up costing more to drive that truck home than it makes with its freight load. Improved freight trucking revenue profit margins.
Knowing freight costs in advance is essential to keep total landed costs in check Understanding transportation freight costs and current freight rates for lanes must be the primary goals of cost analysis. Learn more about how your company can achieve those goals by requesting a SONAR demo online today.
Implementing predictive traffic analysis and real-time GPS tracking can help navigate these issues, allowing for immediate rerouting if needed for an effective delivery schedule. Improved optimal route analysis not only enhances schedules but also boosts customer satisfaction by ensuring timely deliveries. Start Using RouteManager!
Making meaningful use of truckload shipping platforms helps fleets secure higher capacity trucks and trailers. Several challenges face the trucking industry today, and cold transportation needs are again at the center of much more than just the food supply chain. Request a SONAR Demo.
Exporters choosing these options could face increased trucking and rail rates as demand increases for shifts to other ports. Europe – N. America weekly prices fell 4% to $2.06/kg. Imports on vessels with scheduled Baltimore port calls will be diverted to other ports while the closure continues.
And the overall industry trucking trends imply an absolute need to grow more strategically. According to FleetOwner , “ trucking companies must go where the data leads them, not where they think it is going to lead them. The best and only successful way to overcome flawed data analysis is to use effective technology.
Dive deeper into freight data that matters Stay in the know in the now with instant freight data reporting Sign up for Free Analysis A massive container explosion on a vessel docked at the Port of Ningbo on Friday – the most destructive of several recent container fires – closed the port’s Phase III Terminal for 60 hours over the weekend.
The problem: Shipping demand management includes a need to source capacity around the clock Capacity rules when it comes to keeping the supply chain moving and the trucks full. Being proactive with trucking and shipping loads still exemplifies the best way to achieve these goals while also maintaining the competitive advantage.
Enterprise shippers have always been an integral part of the maritime shipping industry and its partnership with truck fleet management. Unfortunately, ocean shipments data is rarely easily accessible or available for analysis by enterprise shippers. Get started by requesting a FreightWaves SONAR demo via the button below. .
These short-haul trucks deliver FTL or LTL freight loads between one form of transport and another.” The better global retailers and BCOs understand market conditions through smart data analysis, the easier they will secure on-time drayage moves or deliveries. Request a SONAR Demo.
This remains key to the overall success of investments within supply chain analysis. Without a clear plan, limited visibility and restrictions on communication and data sharing will have a ripple effect throughout the entire supply chain, and maximizing trucking rate savings grows ever more difficult. Request a SONAR Demo.
Start saving time and get your free supply chain analysis with Trinity Logistics. It’s imperative to take note of whether a truck can deliver to single or multiple locations and arrive on time, factoring in the drivers’ hours of service (HOS) and loading and unloading times.
Dive deeper into freight data that matters Stay in the know in the now with instant freight data reporting Sign up for Free Analysis Salvage crews have already started working to clear the wreckage from last week’s bridge collapse in Baltimore. Europe – N. America weekly prices fell 2% to $2.01/kg.
According to Supply Chain Dive , “The number of supply chain professionals who say they’re currently using predictive analytics at their company has grown 76% from 2017 to 2019, according to a Supply Chain Dive analysis of the annual MHI Industry Report.” Request a SONAR Demo.
Improved planning through wait time analysis benefits all parties. Ocean freight impacts on trucking is another use case. Ocean freight that arrives in a port means opportunities for trucking companies. Higher port activity leads to tighter trucking capacity in portside O/D pairs. Request a SONAR Demo.
Yes, there is the balancing of palletized shipments into full truckload shipments to ensure a truck is loaded properly. Freight load balancing means capturing the data needed to make proactive decisions regarding where to send trucks, which moves have the strongest profitability opportunities, and when to reject a tender based on that data.
Fuel costs: Last-mile fuel costs require careful management as they make up 25% of a truck’s operational costs over volatile price fluctuations. A recent analysis by the American Trucking Associations (ATA) indicates that if existing trends persist, we could see a potential driver shortage reaching up to 175,000 by 2024.
In shipping, documentation, freight insurance, terminal problems, and trucking shortages are just a few of the problems we face today. Hapag-Lloyd recently announced the demo of e-bill of ladings that have been used in recent months. But the biggest issue to address in the documentation category is the bill of lading (BL).
The TMS used should be capable of handling various aspects of transport management including needs assessment, effective analysis, integration and management in addition to providing you visibility on inbound products, receiving, storing and distribution. MY.SHIPPING.
Predictive rate analysis and implementation across the supply chain Utilizing real-time data and automated analysis provides valuable information to the network. And predictive rates have a natural implication for improved trucking RFP processes, aligning rates with market conditions and more. Request a SONAR Demo.
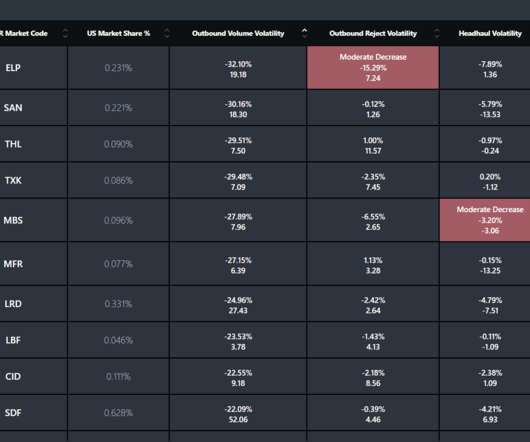
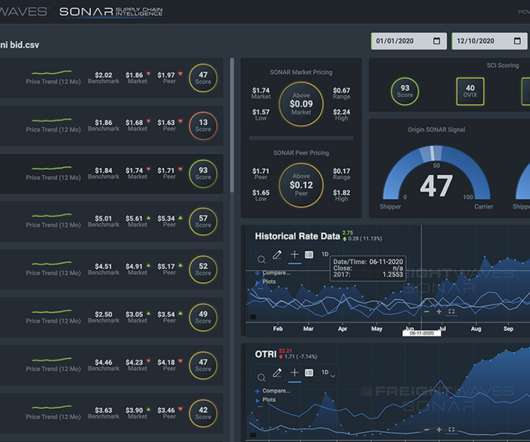
In this article, you learn what are the various reefer freight data indices available in SONAR, who in the freight market relies on these indices, what the indices tell freight market participants, and real-world scenario analysis of using SONAR refrigerated shipping indices to better understand the freight market.
Here are the top FreightWaves’ Freightcast Podcasts: WHAT THE TRUCK?!? “ WHAT THE TRUCK?!? Fuller Speed Ahead is FreightWaves CEO Craig Fuller’s deep dive interview show with top thought leaders in trucking, freight, supply chain, and FreightTech. Trucking for Millennials. Trucking for Millennials.
According to the American Trucking Association, the industry faced a shortage of over 80,000 drivers in 2021, projected to grow to 160,000 by 2030 if current trends continue. Current State of Driver Availability Statistics The trucking industry, which is pivotal to the economy, is grappling with an unprecedented shortage of drivers.
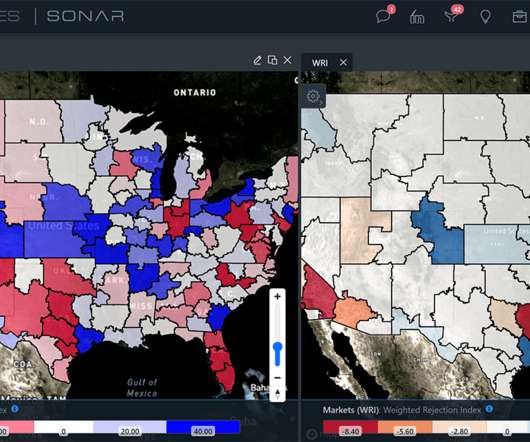
This lane-level intelligence provides insight into specific markets, origin/destination stability and contracted rates to inform both short-term and long-term (annual) trucking RFPs , freight network optimization decisions and more. Have confidence in lane-by-lane freight shipping bid analysis with Lane Acuity Plus.
Part of that strategy lies in using the right transportation data, analysis and insightful reports, such as those provided within FreightWaves SONAR, to guide day-to-day operations. Up to 70% of all OTR trucking in the U.S. Passport data and analysis guide decisions based on an overall strategy tailored to your brokerage.
This approach is cumbersome and fraught with challenges such as limited visibility, inefficient data management and difficulties in bid analysis. Traditionally, shipping companies have relied on manual tools and processes, predominantly managing their requests for proposals (RFPs) and bids using simple spreadsheets.
Using historical data, freight managers can identify when more inventory, human resources, trucks and revenue may be needed. That kind of analysis creates a stronger level of supply chain agility. Click the button below to learn more about the power of data analysis by request a free SONAR demo. . Request a SONAR Demo.
This trend is changing land use patterns and contributing to increased truck traffic and competition for curb space in residential areas. Consistency in data aggregation and analysis are key to maintaining index validity, applicability and actionability. Instantaneous analysis. Request a SONAR Demo. Near-real-time data.
We organize all of the trending information in your field so you don't have to. Join 84,000+ users and stay up to date on the latest articles your peers are reading.
You know about us, now we want to get to know you!
Let's personalize your content
Let's get even more personalized
We recognize your account from another site in our network, please click 'Send Email' below to continue with verifying your account and setting a password.


Let's personalize your content