This site uses cookies to improve your experience. To help us insure we adhere to various privacy regulations, please select your country/region of residence. If you do not select a country, we will assume you are from the United States. Select your Cookie Settings or view our Privacy Policy and Terms of Use.
Cookie Settings
Cookies and similar technologies are used on this website for proper function of the website, for tracking performance analytics and for marketing purposes. We and some of our third-party providers may use cookie data for various purposes. Please review the cookie settings below and choose your preference.
Used for the proper function of the website
Used for monitoring website traffic and interactions
Cookie Settings
Cookies and similar technologies are used on this website for proper function of the website, for tracking performance analytics and for marketing purposes. We and some of our third-party providers may use cookie data for various purposes. Please review the cookie settings below and choose your preference.
Strictly Necessary: Used for the proper function of the website
Performance/Analytics: Used for monitoring website traffic and interactions
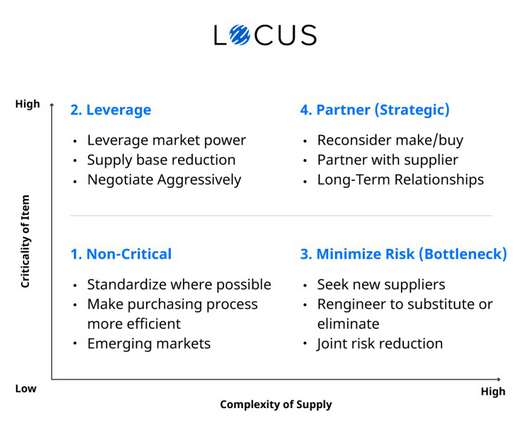
Milkrun Optimization Plus & Transport Optimization Plus Apps: Precision in Routing and Cost Control The latest update introduces the External Cost feature, a powerful “make or buy” decision-making tool, enabling businesses to evaluate whether handling deliveries in-house or outsourcing to a third party is more cost-effective.
Most supply chain and logistics teams have recognized that the only way to combat todays incredible level of uncertainty is by adopting and applying digital tools. The pace and scope of supply chain disruption are beyond human cognition, manual analysis, and consumer-grade spreadsheet tools.
Quality and Detail of Data and its Analysis In some of our earlier posts, weve stressed the importance of simplicity in distribution network design , and we will return to that topic later in this article. It’s not a short list, so we’ll set it down here as a summary to help you with plans for analysis.
Most importantly, it should fully integrate with your shopping cart, website, mobile app, social sales channels, marketplaces, retailers, payment systems, EDI and ERP systems, and any other app or tool you use to manage your business. It should have robust tools for data analysis, reporting, tracking, forecasting and managing inventory.
Using technology to de-risk supply chains From a technology perspective, supply chain design tools have been developed from the ground up to handle uncertainty and risks, generate scenarios that identify risks proactively, and provide solutions to mitigate these risks. This is where AI can make all the difference.
The best way to do that is to have a global Transportation Management System (TMS) that has the flexibility, strength, and configurable rules to provide your logistics team with the best tools for managing constant changes in their global supply chains. Allow for ‘what if’ transportation analysis.
Quality and Detail of Data and its Analysis In some of our earlier posts, we’ve stressed the importance of simplicity in distribution network design , and we will return to that topic later in this article. It’s not a short list, so we’ll set it down here as a summary to help you with plans for analysis.
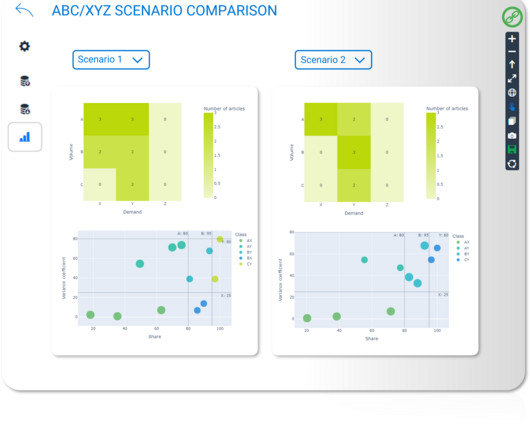
Map Comparisons: Comprehensive Scenario Analysis Log-hub 4.3 Extension of the Log-hub KNIME nodes Supply Chain Apps seamlessly extend beyond the traditional Excel environment, offering enhanced integration options that allow for direct and user-friendly optimization within users’ workflow environments. With the Log-hub 4.3
The ability to connect the dots between the nodes in that ecosystem is the next step forward in visibility. Andrew says companies are feeding the data into their TMS applications for analysis. It’s hard to do that with EDI because you have to wait for someone to send you that information.
The Freight Matrix App has evolved from a pure Excel-based tool to a cloud-based platform, fostering collaboration, customization, and transparency in freight management. Integration with KNIME Nodes and APIs offers advanced freight cost calculation, simulation, and transport cost evaluation across various shipment levels.
The Freight Matrix App has evolved from a pure Excel-based tool to a cloud-based platform, fostering collaboration, customization, and transparency in freight management. Integration with KNIME Nodes and APIs offers advanced freight cost calculation, simulation, and transport cost evaluation across various shipment levels.
It allows them to perform sensitivity analysis, which in turn, helps them plan in advance for any such disruptions. This tool enables them to build a supply chain network design that incorporates business needs, customer demand and constraints. Determine the ideal number of nodes and warehouse service level. Conclusion.
Programming languages are very useful tools for companies when it comes to automating boring and repetitive tasks to focus on more creative ones. In this post, a tour of the most popular programming languages in the sector will be made, as well as the databases from which the information can be retrieved for analysis.
Given the above, the report finds that UK freight decarbonisation strategy can be most efficiently informed by a whole freight system, whole UK analysis capability, which needs to couple detail on both infrastructure and vehicle/vessel fleets with operational and technology specifics.
By incorporating different fixed and variable costs based on weight or volume assigned to the warehouse, this tool enables a more precise and realistic determination of warehousing costs. For those familiar with the intricacies of warehouse costs, Log-hub’s Stepwise Cost Function revolutionizes network design calculations.
Strategic competition has economic and commercial overtones, with sanctions and trade restrictions used as tools of coercion or – as with China’s Belt and Road initiative – a way to form tight strategic and geoeconomic relationships in the region. But there’s more to be concerned about.
With the Contracts and Chargeback solution on the MediLedger Network, we are connecting trading partners in a trusted network that ensures everyone can be aligned on the latest updates to customer or contract information, automating the analysis and impact of those updates, and ensuring the chargeback is accurate every time.
ABC Analysis: A form of Pareto analysis applied to a group of products to enable selective inventory management controls. ABC Classification: The classification of inventory, after ABC analysis, into three basic groups for the purpose of stock control and planning. Economic Order Quantity (EOQ).
We organize all of the trending information in your field so you don't have to. Join 84,000+ users and stay up to date on the latest articles your peers are reading.
You know about us, now we want to get to know you!
Let's personalize your content
Let's get even more personalized
We recognize your account from another site in our network, please click 'Send Email' below to continue with verifying your account and setting a password.


Let's personalize your content