This site uses cookies to improve your experience. To help us insure we adhere to various privacy regulations, please select your country/region of residence. If you do not select a country, we will assume you are from the United States. Select your Cookie Settings or view our Privacy Policy and Terms of Use.
Cookie Settings
Cookies and similar technologies are used on this website for proper function of the website, for tracking performance analytics and for marketing purposes. We and some of our third-party providers may use cookie data for various purposes. Please review the cookie settings below and choose your preference.
Used for the proper function of the website
Used for monitoring website traffic and interactions
Cookie Settings
Cookies and similar technologies are used on this website for proper function of the website, for tracking performance analytics and for marketing purposes. We and some of our third-party providers may use cookie data for various purposes. Please review the cookie settings below and choose your preference.
Strictly Necessary: Used for the proper function of the website
Performance/Analytics: Used for monitoring website traffic and interactions
According to a 2016 McKinsey & Company report : “Data and analytics underpin several disruptive models. Introducing new types of data sets (”orthogonal data”) that can disrupt industries, and massive data integration capabilities can break through organizational and technological silos, enabling new insights and models.
Many of the most beneficial tools come from the utilization of data and analytics. Data and analytics provide carriers with an incredible wealth of information that has proven to bolster revenue and profits. How carriers create data-driven pricing strategies. Fill out the Form Below to Access a COPY of the WhitePaper.
This whitepaper will explore the foundation of a strong brokerage – the freight brokerage toolkit and discuss the following themes: Brokers’ top challenges leading to poor profitability or negative customer experiences. Technologies critical to making the use of data successful in the back office.
In other words, supply chain leaders need to validate and measure the success (read “accuracy”) of data source analytics and how well they stack up to the observed market conditions. Fill out the Form Below to Access a COPY of the WhitePaper. The impeccable value of accuracy in all predictive analytics insights.
It’s also possible that SONAR subscribers are the same companies that buy all available freight data (so you could also say that Brand X’s customers also outperform). FILL OUT THE FORM BELOW TO DOWNLOAD THE FREE WHITEPAPER. The post [WHITEPAPER] SONAR Customers Outperform appeared first on SONAR.
The timing of Hurricane Ida, which took place in the days leading up to Labor Day, made it difficult to separate the hurricane’s impact and the impact of normal seasonality on many of the nationwide data sets. FILL OUT THE FORM BELOW TO DOWNLOAD THE FREE WHITEPAPER. Request a SONAR Demo. Request a SONAR SCI Demo.
Big data in the supply chain is nothing new. Nearly every shipper, broker and carrier collects and uses data to derive insights, including predictive rates. The value created with real-time data and right-now lane-level analysis to enforce compliance. Fill out the Form Below to Access a COPY of the WhitePaper.
This “SONAR highlight reel,” which we plan to publish every other week, is intended to concisely hit data highlights and trends in truckload, intermodal and maritime. The end of the second quarter is typically a strong period for truckload freight and this year is no exception. FILL OUT THE FORM BELOW TO DOWNLOAD THE FREE WHITEPAPER.
To help shippers understand the value of data-driven bidding in the short- and long-term, powered by Lane Acuity, this whitepaper will explore: Common problems in managing annual RFP processes for enterprise shippers. How contract data amounts to tactical bidding management. Request a SONAR Demo.
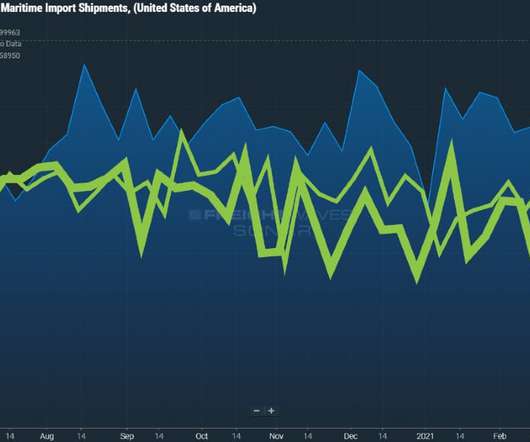
This “SONAR highlight reel,” which we plan to publish every other week, is intended to concisely hit data highlights and trends in truckload, intermodal and maritime. Maritime data suggests that further shipment delays, elevated ocean rates and a strained domestic transportation network should be expected. Request a SONAR Demo.
This “SONAR highlight reel,” which we publish every other week, is intended to concisely hit data highlights and trends in truckload, intermodal and maritime. Truckload demand has stabilized at a high level after declining seasonally to start the fourth quarter. FILL OUT THE FORM BELOW TO DOWNLOAD THE FREE WHITEPAPER.
View the Full WhitePaper. In fact, our data shows that accepted tender volume is up 12% y/y. SONAR intermodal contract rate data shows rates up 19% from this time last year. Maritime import volume remains robust and it appears that the ports of LA and Long Beach will announce a record December when the data is released.
Goods for the holiday shopping season are largely already stateside, which has led to a decline in our forward-looking ocean bookings data. FILL OUT THE FORM BELOW TO DOWNLOAD THE FREE WHITEPAPER. The post [WHITEPAPER] Peak Season Forecast: Another truckload capacity crunch appeared first on SONAR.
In a previous guest blog, The Rodon Group along with Rethink Robotics wrote, titled " Can Robots + Humans = The Ideal Workforce in Manufacturing? ": Robots such as Baxter can also help companies save money and increase productivity. In a recent blog post “Robots In, Humans Out, Game Over?” How could that be a bad thing?
This “SONAR highlight reel,” which we publish every other week, is intended to concisely hit data highlights and trends in truckload, intermodal and maritime. Spot rates continue to rise as freight flows to the spot market – particularly on the West Coast. FILL OUT THE FORM BELOW TO DOWNLOAD THE FREE WHITEPAPER.
View the Full WhitePaper. See description of the just-released FreightWaves Trusted Rate Assessment Consortium (TRAC) spot rate data on pages 5-6. The post [WHITEPAPER] SONAR highlight reel: Contrary to typical seasonality, intermodal volume rises in Nov. The current time from anchor to berth at the Port of L.A.
From there, we recommend using a variety of data sets in SONAR to help quantify the degree of inflation or deflation in rates you should expect for the freight you are putting out to bid. FILL OUT THE FORM BELOW TO DOWNLOAD THE FREE WHITEPAPER. Request a SONAR Demo. Request a SONAR SCI Demo.
Without adequate data and information on the freight market, shippers can find themselves in the same disadvantageous position as Mr. David. FILL OUT THE FORM BELOW TO DOWNLOAD THE FREE WHITEPAPER. The post [WHITEPAPER] SONAR SCI: Holding carriers accountable means knowing the freight market appeared first on SONAR.
Editor's Note: Todays blog is from Kristen Palmisano from The Center for Global Enterprise. In this blog, Kristen discusses how revenue growth is tied to digital supply chains. The paper presents evidence from 24 top executives running the world’s largest supply chains. Read the whitepaper here.
Since brokers need to start thinking more about how to maximize the tech stack, it’s essential to understand a few things, which will be further explored in this part 1 of a 2 part whitepaper series: The overall state of digital transformation within brokerages. Why data for the sake of data fails to add value.
Data has become an integral part of the supply chain network’s daily operations and is inseparable from the modern processes that govern procedures involved in transportation. Anything other than up-to-date, near-real-time freight data will make the work of the management team all the more difficult. Request a SONAR Demo.
The insights generated are the product of a deep bench of domain experts backed by the proprietary data and analytics housed in SONAR. . Fill out the Form Below to Access a COPY of the WhitePaper. The post [WHITEPAPER] The 2021 freight market outlook forecast appeared first on SONAR. Request a SONAR Demo.
The free whitepaper, Data in the fast lane – managing automotive logistics amid component shortages, shows how automotive shippers can leverage near real-time data to lower transportation costs, as well as the impacts of the potential CN-KCS merger. FILL OUT THE FORM BELOW TO ACCESS THE FREE WHITEPAPER.
Tracking and managing transportation by understanding freight data, particularly tender rejections and a cohort of core analytics, is the only path forward. Since freight management is a continuously evolving strategy, this whitepaper will delve into: The issues contributing to and deriving from lagging data.
Brokerages, freight forwarders, shippers, carriers, and other logistics service providers (LSPs) need to realize that the only way forward lies in the proper application of data and a robust freight tech stack. To that end, this whitepaper will explore: The problems that appear from a lack of data and transparency in decision-making.
Download the guide, now , or read this blog first to find out what it’s about. Pain point four – Computer break down results in the loss of data. Daniel is the company's Head of Content and specialises in the production of web copy, articles, blogs, press releases and whitepapers, for use by Armagard's marketing team.
On this episode of #WithSONAR, current SONAR subscriber Greg Morrow, the Director of Operations for ARL Logistics , discusses the importance of using data to grow and strengthen carrier and customer relationships with co-hosts Kyle Taylor and Luke Falasca. SONAR provides that data. Download the WhitePaper.
The free whitepaper, Data in the fast lane – managing automotive logistics amid component shortages, shows how real-time data can enhance decision-making around the supply chain. FILL OUT THE FORM BELOW TO ACCESS THE FREE WHITEPAPER. Request a SONAR Demo. Request a SONAR SCI Demo.
This “SONAR highlight reel,” which we plan to publish every other week, is intended to concisely hit data highlights and trends in truckload, intermodal and maritime. FILL OUT THE FORM BELOW TO DOWNLOAD THE FREE WHITEPAPER. The post [WHITEPAPER] SONAR highlight reel: Intermodal congestion worsens appeared first on SONAR.
And to help carriers achieve that goal, this whitepaper will explore a few best practices to reduce operating costs, including: The importance of meaningful data capture. Prioritizing moves based on inbound and outbound data trends. Tracking and applying equipment data insights. Visualization capabilities.
The data suggest that ocean congestion and service issues are not likely to be alleviated near-term. FILL OUT THE FORM BELOW TO DOWNLOAD THE FREE WHITEPAPER. The post [WHITEPAPER] Ocean shippers trapped in house of pain appeared first on SONAR. ports, particularly the Ports of Los Angeles and Long Beach.
Supply chain intelligence and actionable insights must apply the most accessible, near real-time data available. Analytic data resources for brokers are great, but it’s equally important to realize that FreightWaves SONAR is much more than a broker-exclusive resource. Download the WhitePaper.
We often demo SONAR to customers that want to see every domestic freight dataset we have to offer while showing little interest in our ocean data. FILL OUT THE FORM BELOW TO DOWNLOAD THE FREE WHITEPAPER. The post [WHITEPAPER] Ocean markets drive the domestic freight markets appeared first on SONAR.
Today, we continue our series highlighting our top blog posts of the year! That then allows us to create more of that kind of content for our award-winning blog This year we will feature the top blog posts by page views in the following categories: Manufacturing , Logistics , Freight , and the Supply Chain. Read more here.
We trudge on with our top posts from our main blog categories by page view for all of 2014 from the Cerasis blog by featuring another area Cerasis is an expert in: Transportation. Top 16 Most Popular Transportation Blog Posts of 2014. Read the Full Blog Post. Read the Full Blog Post.
View the Full WhitePaper. The data is derived from sourcing spot rates from more than a dozen 3PLs and freight brokerages. The data is derived from sourcing spot rates from more than a dozen 3PLs and freight brokerages. FreightWaves released the Trusted Rate Assessment Consortium (TRAC) spot rates last week.
This “SONAR highlight reel,” which we publish every other week, is intended to concisely hit data highlights and trends in truckload, intermodal and maritime. FILL OUT THE FORM BELOW TO DOWNLOAD THE FREE WHITEPAPER. Holiday noise is dramatically impacting the major truckload indicators. Request a SONAR Demo.
This “SONAR highlight reel,” which we publish every other week, is intended to concisely hit data highlights and trends in truckload, intermodal and maritime. FILL OUT THE FORM BELOW TO DOWNLOAD THE FREE WHITEPAPER. Meanwhile, tender rejection rates have climbed 200 basis points since the beginning of August.
Viewing where overpaying/underpaying risks are within their network allows for more targeted approaches during the RFP process and will likely lead to holding the line on budgets more effectively than using just historical data in the ever-evolving transportation environment. FILL OUT THE FORM BELOW TO DOWNLOAD THE FREE WHITEPAPER.
Data for data’s sake lacks value, especially in the view of the supply chain. And across the market, submitted data becomes rapidly outdated. And in some industries, outdated data can have disastrous consequences. For instance, take the value added by more accurate data in the health industry.
This “SONAR highlight reel,” which we publish every other week, is intended to concisely hit data highlights and trends in truckload, intermodal and maritime. FILL OUT THE FORM BELOW TO DOWNLOAD THE FREE WHITEPAPER. Freight demand is unwavering on the back of a strong consumer, which sets up a stronger than normal peak season.
This “SONAR highlight reel,” which we plan to publish every other week, is intended to concisely hit data highlights and trends in truckload, intermodal and maritime. Accepted truckload tender volumes hit a new data series high in the past week while the nationwide tender rejection rate declined to its lowest level in more than five months.
Global trade data and shipping demand management are not just things that high-tech companies and international investors need to worry about. This focus makes proper use of global trade data and analytics so vital for continued recovery and growth throughout the supply chain network. Download the WhitePaper.
The free whitepaper, Peak Season Forecast: Another truckload capacity crunch , highlights SONAR data to show how we believe peak season will manifest. FILL OUT THE FORM BELOW TO DOWNLOAD THE FREE WHITEPAPER. Request a SONAR Demo. Request a SONAR SCI Demo. The post What is expected during peak season?
We organize all of the trending information in your field so you don't have to. Join 84,000+ users and stay up to date on the latest articles your peers are reading.
You know about us, now we want to get to know you!
Let's personalize your content
Let's get even more personalized
We recognize your account from another site in our network, please click 'Send Email' below to continue with verifying your account and setting a password.


Let's personalize your content