This site uses cookies to improve your experience. To help us insure we adhere to various privacy regulations, please select your country/region of residence. If you do not select a country, we will assume you are from the United States. Select your Cookie Settings or view our Privacy Policy and Terms of Use.
Cookie Settings
Cookies and similar technologies are used on this website for proper function of the website, for tracking performance analytics and for marketing purposes. We and some of our third-party providers may use cookie data for various purposes. Please review the cookie settings below and choose your preference.
Used for the proper function of the website
Used for monitoring website traffic and interactions
Cookie Settings
Cookies and similar technologies are used on this website for proper function of the website, for tracking performance analytics and for marketing purposes. We and some of our third-party providers may use cookie data for various purposes. Please review the cookie settings below and choose your preference.
Strictly Necessary: Used for the proper function of the website
Performance/Analytics: Used for monitoring website traffic and interactions
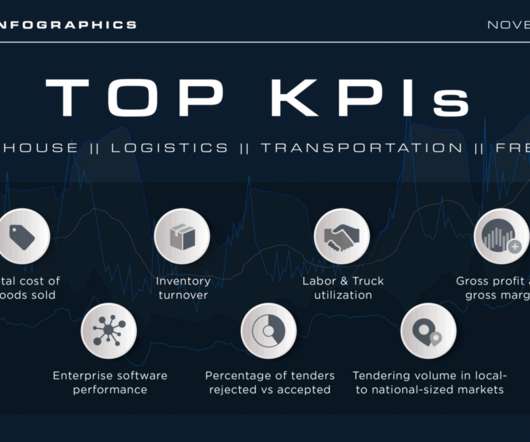
They’re called metrics, a set of constantly changing numbers and percentages that tell you how you’re doing from one day to the next. There are dozens of metrics you could track, but some are so important you should check them frequently. These are the metrics you want on your dashboard. What is a Metric?
Supply chain professionals responsible for transportation procurement at Fortune 500 companies focus on three things – budget forecast accuracy, service scores and primary tender acceptance. harder to procure capacity at the benchmark rate per mile ) in both the outbound and inbound directions.
Spot freight provides a short-term way to source capacity and boost procurement outside of contracted rates whether TL or LTL. Consider this; as reported by Louis Columbus of Forbes , “Machine learning algorithms and the apps running them are capable of analyzing large, diverse data sets fast, improving demand forecasting accuracy.”
As reported by DC Velocity , “the 2020 Fleet Advantage Industry Benchmark Survey noted, “11% of transportation fleets estimate they have saved more than $1 million in crash avoidance by upgrading to newer trucks with advanced safety features.” Financial insight feeds into equipment purchasing decisions. Request a SONAR Demo.
As reported by Brian Barry of Multichannel Merchant , it is simple: “Don’t try to write and enforce the ideal policy in one step. Tracking the total volume of inbound and outbound freight, not to mention its contingent factors through these metrics, adds value by enabling proactive transportation management. Request a SONAR demo today.
Customers are mostly anonymous, and purchases are made or abandoned, seemingly on a whim. This data usually includes the customer’s contact information, address, purchase history, social media engagement, email click-throughs, and dozens of other data points as they become available.
Start where it all begins – procurement. Procurement remains an oft-overlooked side of a freight spend analysis. All forward and reverse costs should be considered within a comprehensive spend analysis. That’s the only way to understand the real costs of transportation in your enterprise. . Download the White Paper.
This blog delves into essential acronyms and abbreviations, from BOPIS to WISMO, that are pivotal for optimizing supply chains and elevating customer satisfaction. In a way, this model is a win-win as it saves return logistics costs for retail businesses. Read Also: FMCG Sales Beat – Insight Report 23.
Blockchain Prevents Unsuspecting Purchases of Counterfeit Drugs and Medical Devices. Pharma ceutical supply chains suffer an annual global loss of more than $200 billion due to counterfeit medications, reports Mike Miliard of Healthcare IT News.
In addition, e-commerce’s already strong secular trend accelerated through the period as the nation stayed home while still purchasing goods for delivery, enhancing the outlook for final-mile delivery. The insights generated are the product of a deep bench of domain experts backed by the proprietary data and analytics housed in SONAR. .
Analytics-driven processes are the go-to strategies for all freight management parties that seek to increase profitability. As reported by Mindy Long of Transport Topics , “One of the challenges for fleets collecting a wealth of data is determining what information is actionable.” Request a SONAR Demo.
Yes, the need for shipping demand analytics is not new and was echoed in 2013 by Industry Week , “Relying on traditional supply chain execution systems is becoming increasingly more difficult, with a mix of global operating systems, pricing pressures and ever-increasing customer expectations. That’s where data analytics comes in.”
By value , we mean how much that inventory cost to make or purchase, plus how much it’s costing you to store it. Ending Inventory + COGS – Purchases = Beginning Inventory. Beginning Inventory + Purchases – COGS = Ending Inventory. Beginning Inventory + Purchases – COGS = Ending Inventory.
.” The 2024 Market Guide noted that “New digitalization initiatives, the increasing adoption of e-commerce, and the need to optimize transportation costs to improve the end-consumer experience and increase brand engagement are some of the challenges LMD solutions must solve. Take a look at our demos! and internationally.
The Operating Ratio (OPRAT) index provides total operating costs divided by operating revenue, which is derived from Truckload Carriers Association (TCA) members and is reported on a monthly basis. That includes total fuel costs for purchasing rack diesel fuel price , fuel additives, diesel exhaust fluid and taxes.
Say you purchase your coveted gadget online, eagerly tracking its journey from warehouse to your welcoming hands. Customer satisfaction and keeping costs in check rests on optimal last-mile delivery operations. In 2021, a wide range of major product categories saw online purchase returns, with rates varying from 8% to 88%.
The Maintenance Expense per Mile (MAINT) index captures the total maintenance expense, reported by participating carriers during a given month, expressed on a per-mile basis. The expense reported is specific to the maintenance of company-owned trucks, and company fleet-allocated trailers. Maintenance Expense per Mile (MAINT).
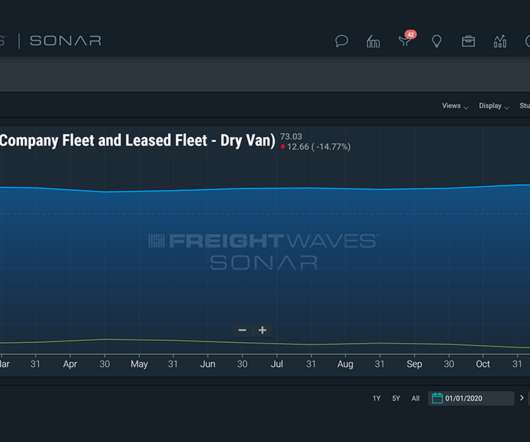
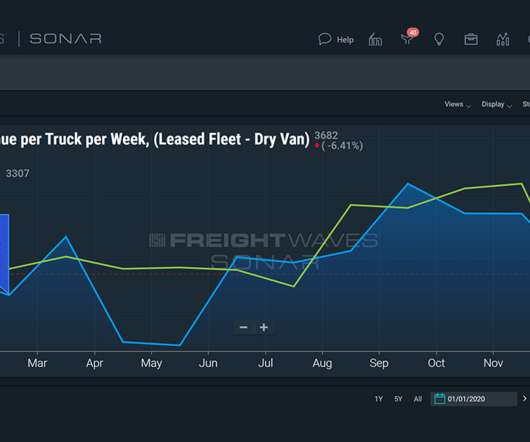
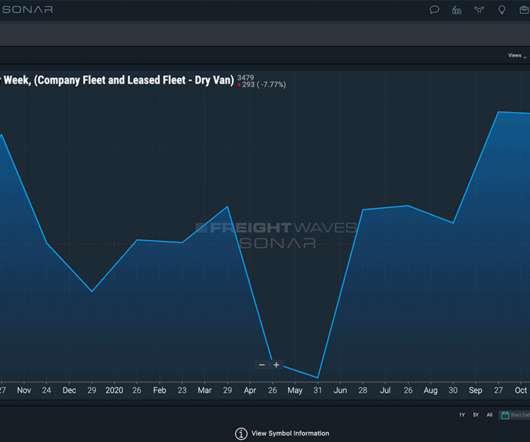
For part-time, the counts are reported on a full-time-equivalent (FEL) basis. The carriers reporting the data for this index are participants in the Truckload Carriers Association’s TPP program. As with DEVREV, the carriers reporting the data for this index are participants in the Truckload Carriers Association’s TPP program.
The carriers reporting the freight data for this index are participants in Truckload Carriers Association’s TPP program. This index, for small populations of drivers, is highly dependent on the States and Provinces that each reporting carrier operates within.
Did you know that 93% of consumers say that online reviews influence their purchase decisions? Referrals One of the first things consumers do when making a big purchase is ask friends and family for recommendations. That’s a mind-blowing statistic. Why are other people’s opinions so darn important to us?
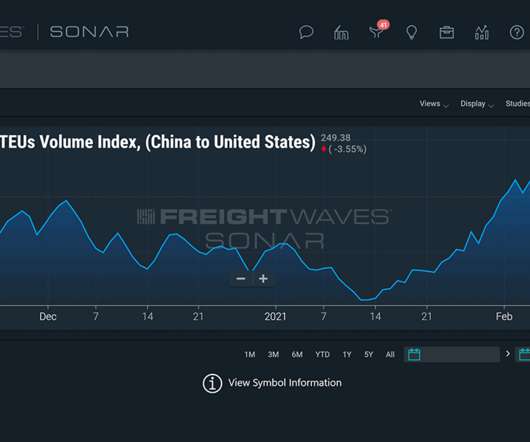
SONAR’s Ocean Shipments Report and Ocean TEUs indices show subscribers how much cargo is shipping to and from the United States. What do the Ocean Shipments Report and OceanTEUs indices tell freight market participants? Rather than relying on historical data being reported by ports or U.S. and are reported by U.S.
While descriptive analytics can help carriers understand what happened, knowing when to refuse loads or charge a higher cost can be difficult. Quite simply, it costs money to ship freight and the amount can vary significantly by region, zone, mode and more. Debt and interest payments are not included in these costs.
You can purchase a ring light for as little as $30. If you do need to present a demo, PowerPoint, or other material on a call, then you will need to use your laptop. The SONAR platform is the only freight forecasting and analytics platform that offers real-time freight market intelligence driven off actual freight contract tenders. .
Total cost of goods sold The total cost of goods sold is among the most prominent and most influential metrics in supply chain management. It is a measure of the beginning inventory cost plus the purchases made during the period, minus the ending inventory costs. Request a SONAR demo online to learn more.
Advanced analytical insights: With advanced supply chain analytics from Locus’ offerings, businesses can solve many inefficiencies, complexities, and bottlenecks that make their last-mile delivery expensive. It has saved $275 million in logistics costs and 10m + kgs in Greenhouse gas emissions. appeared first on Locus Blog.
The indices are reported on a 14-day (Initial, 1) and 28-day (Final, F) lag on a national level. As stated earlier, each mode has two tickers, one for the initial report, which has less than 50% of the total volume and another final report which has more than 90%. Request a SONAR Demo. Van initial (14-day) – VCRPM1.USA
For sheer volume, purchasing third-party leads are useful for most freight brokerages. The SONAR platform is the only freight forecasting and analytics platform that offers real-time freight market intelligence driven by actual freight contract tenders. . Request a SONAR Demo. 6: External lead lists .
Retailers must ensure products move seamlessly from warehouses to customers while keeping costs low and satisfaction high. In this blog, we spotlight the top six retail logistics software companies in the US , examining how they are revolutionizing logistics management and setting new standards for efficiency and reliability.
What’s more, nearly a fifth are at the forefront, harnessing advanced tools like control towers and analytics to maintain their competitive stance. Echoing this movement, McKinsey spotlights how adopting advanced analytics in distribution retools the daily workflows of frontline staff, boosting retention by 15%.
billion, according to Adobe Analytics , up 7.5% Will consumers be reluctant to use credit cards for holiday purchases? For the first time, mobile purchases have overtaken desktop purchases. Shopify reports that sales were up 24% compared to last year, with 61 million consumers shopping globally this year.
This blog explores the top five retail logistics software companies in Saudi Arabia, highlighting their unique features, capabilities, and how they are transforming the logistics landscape for retailers across the region. 7 Ways Retailers Can Reduce Delivery Costs 2. Schedule a demo with us now! Still confused?
For instance, 41% of global shoppers expect same-day delivery for their purchases. Cost Considerations: A significant financial and environmental cost for shippers and carriers hides as empty miles. accounting for 61 billion empty miles and 87 million metric tons of unnecessary annual emissions.
We’ve been busy fine-tuning our platform, nailing our pitch, bringing on new customers, demoing for clients, and speaking at and attending different freight and logistics conferences. For everyone that hasn’t had a chance to tune in yet, we have made the recording public on our blog. . To read the full announcement, visit our blog.
According to a recent report, companies that earn $1 billion annually can expect to earn, on average, an additional $700 million within three years of investing in customer experience. Our advanced scheduling optimization software has dynamically priced, customer delivery slots for both online and in-store purchases. Schedule Demo.
Shockingly, according to a Gartner report, only 21% of companies boast a robust supply chain network that provides adequate visibility and agility. Intelligent data at your beck and call: Locus’ advanced analytics capabilities takes the complexity of last-mile data and presents it to supply chain managers as actionable insights.
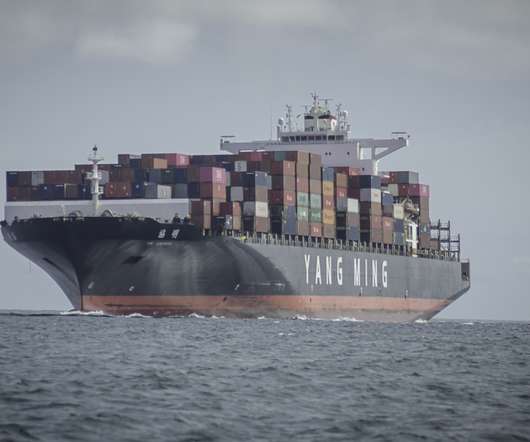
While that may be too soon to call, it’s clear that these are trying times for shippers and brokers that purchase ocean capacity. Request a SONAR Demo. Request a SONAR SCI Demo. Ocean shipping issues have caused some to question whether Christmas will be cancelled. FILL OUT THE FORM BELOW TO DOWNLOAD THE FREE WHITE PAPER.
As per The State of Online Shopper Expectations and Actions study published by PARCEL , 64% of online shoppers have reported receiving a damaged product. According to Retail Drive, 21% of oversized online purchases arrive damaged each year, with 15% never arriving at all. . appeared first on ShipChain Blog.
As its crucial tech partner, Locus supports its logistics services with functionalities like end-to-end visibility and analytical insights. If available technology aligns with a business’s needs and processes, they’ll purchase it. It has operated in this region for over 65 years. Missed the live session?
To provide consumer experiences for your online shoppers after they make their purchases, click here. In fact, around 300,000 new jobs have already been created in the sector so far and over 500,000 more are expected to be added till Diwali, according to this report , as the demand for gig workers steadily increases. Schedule Demo.
As large volumes of open deck trailers became available for purchase through liquidation, prices became so low that carriers could return their investment on the assets within a few months. That leverage can still be achieved through proper carrier procurement. Request a SONAR Demo. appeared first on SONAR.
Advanced analytics: Locus’ data analytics solution transforms post-execution data into actionable insights, displayed on dashboards, to continually enhance future deliveries. SAP A long-time industry player SAP’s solutions leverage advanced analytics and machine learning to optimize supply chains and drive data-based decisions.
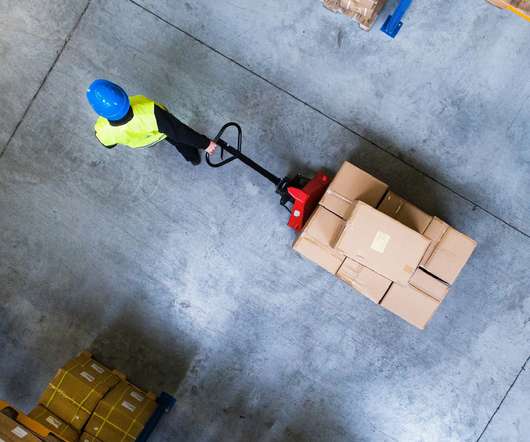
The Logistics Blog®. Rising online purchases over the past few years have increased the need for LTL. Haul lengths reported by respondents varied from 500+ miles to 100-249 miles. About half of those surveyed reported it is sometimes or always a challenge securing LTL capacity for these loads. Accurate reporting.
Ultimately, our automatically generated purchase orders will save you time and money. We use key metrics like demand patterns, sales usage, pick frequency, and demand volatility so you can identify your winners and losers. Book a demo to learn more about EazyStock’s functionality and how it can make your demand planning easier.
While it may be premature to say Christmas is canceled, any company having to purchase capacity on the ocean is facing unprecedented pressure. Request a SONAR Demo. Request a SONAR SCI Demo. The maritime market madness has caused some retailers to wonder if Christmas is going to be canceled.
We organize all of the trending information in your field so you don't have to. Join 84,000+ users and stay up to date on the latest articles your peers are reading.
You know about us, now we want to get to know you!
Let's personalize your content
Let's get even more personalized
We recognize your account from another site in our network, please click 'Send Email' below to continue with verifying your account and setting a password.


Let's personalize your content