This site uses cookies to improve your experience. To help us insure we adhere to various privacy regulations, please select your country/region of residence. If you do not select a country, we will assume you are from the United States. Select your Cookie Settings or view our Privacy Policy and Terms of Use.
Cookie Settings
Cookies and similar technologies are used on this website for proper function of the website, for tracking performance analytics and for marketing purposes. We and some of our third-party providers may use cookie data for various purposes. Please review the cookie settings below and choose your preference.
Used for the proper function of the website
Used for monitoring website traffic and interactions
Cookie Settings
Cookies and similar technologies are used on this website for proper function of the website, for tracking performance analytics and for marketing purposes. We and some of our third-party providers may use cookie data for various purposes. Please review the cookie settings below and choose your preference.
Strictly Necessary: Used for the proper function of the website
Performance/Analytics: Used for monitoring website traffic and interactions
More Resources Home October 22, 2024 Update The Freightos Weekly Update helps you stay on top of the latest developments in international freight by giving you the rundown on the latest economic data, ocean and air demand trends, rate data – and anything else impacting the market. Freightos Air index data shows Middle East – N.
Therefore, produce ready for shipping may be stalled due to a limited supply of equipment and trucks (hindering capacity procurement ), fewer drivers, and the pressure everywhere to move things faster, save money, and get it done without impacting the customer experience. But back to the overarching point.
Companies with access to accurate near-real-time data not only improve their operations; they also gain the ability to depict the current state of the trucking market. That information then leads to improved rates, capacity, and several other benefits. These accurate depictions of the market come from the tracking of data.
Data for data’s sake lacks value, especially in the view of the supply chain. And across the market, submitted data becomes rapidly outdated. And in some industries, outdated data can have disastrous consequences. For instance, take the value added by more accurate data in the health industry.
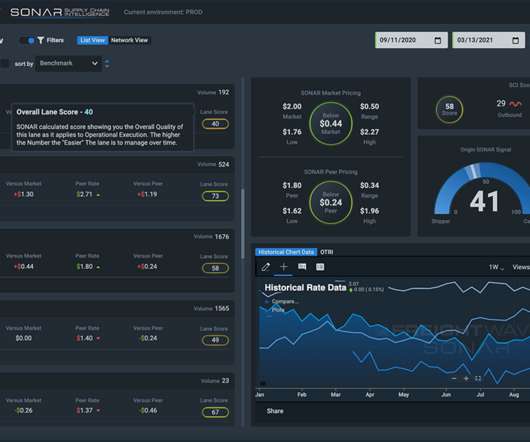
With the proper use of data and freight analytics , contract procurement and securing capacity can be enhanced. The incredible insights that accurate data has to offer combats volatility and unearths a clear understanding of what’s actually happening in the market. Those are the founding principles behind SONAR SCI Lane Acuity.
Supply chain intelligence and actionable insights must apply the most accessible, near real-time data available. Analytic data resources for brokers are great, but it’s equally important to realize that FreightWaves SONAR is much more than a broker-exclusive resource. Market dynamics of freight management can turn on a dime.
Among enterprise companies, one critical aspect of successful negotiation and capacity procurement is a better predictive outlook of both spot and contract truckload rates. Tracking market trends within truckload rates relies heavily on data and analysis. Data-driven insights provide a rubric for guiding RFP processes.
Goods for the holiday shopping season are largely already stateside, which has led to a decline in our forward-looking ocean bookings data. Both factors highlight the very tight capacity environment heading into peak season, which will likely get even tighter during the next two months. Request a SONAR Demo.
Global trade data and shipping demand management are not just things that high-tech companies and international investors need to worry about. This focus makes proper use of global trade data and analytics so vital for continued recovery and growth throughout the supply chain network. Streamline data collection and analysis.
(Graphics created by Emily Ricks) There are ample opportunities to take advantage of spot versus contract freight data insights. Spot freight provides a short-term way to source capacity and boost procurement outside of contracted rates whether TL or LTL. And as mentioned, that TMS data becomes a key SONAR data source.
Reaching mutually beneficial service level agreements (SLA) or trade agreements depends on the access and utilization of current logistics data and a decent amount of preparation. Far too often, there is a severe lack of real-time logistics data to work with during this process. Download the White Paper.
Maintaining good compliance to these informational guides is critical to supply chain management and relies heavily on current data and automation. Missing data amounts to inevitable routing guide failures Data is king in today’s ever-changing market, and it is only becoming more vital for supply chain operations and management.
Successful freight brokerages combine networking and business skills to add capacity through carrier sourcing to secure more customers’ loads. Near real-time data. It’s that simple, and a dynamic RFP guide helps companies leverage mini-bids to reduce capacity loss when market shifts occur unexpectedly. Market intelligence tools.
A great deal of the cost that goes into shipping gets tied up in securing load capacity and budgeting for fees and expenses incurred along the way. Understanding why rate forecasting is so vital and how accurate data and analysis can help improve predictions are essential. Download the White Paper.
Here are 10 shipper of choice tips to help enterprises secure capacity and improve relationships with carriers, not to mention transportation brokers. Respond to issues, deviations and problems with data. Apply these shipper of choice tips to increase eligibility for this status with freight data at your fingertips.
Trucking capacity is tight, and deadheading is the precursor of even stricter capacity. Fortunately, smart data utilization can help reduce deadheading occurrences and make the entire supply chain more profitable. Applied data lowers the risk of over-valuing or under-valuing trucking costs. Think about it.
To survive trends like these and to cut costs as much as possible without cutting quality or losing capacity, changes must occur. It is vital that shippers analyze freight capacity, how the market impacts shipping rates , and use supply chain technology and innovations. Increase data-driven decision-making with freight forecasting.
“What’s the best way to use data to beat your competition as a freight brokerage business?” That’s regardless of whether it’s an asset-based broker or just someone who works with a company to source capacity. Nevertheless, it all adds up to a greater demand for integrated systems and real-time data. Download the White Paper.
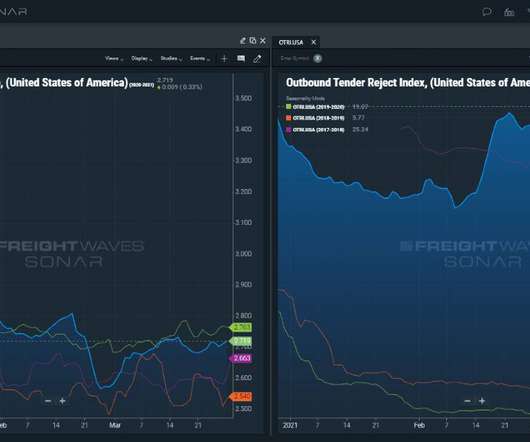
This week, learn how freight market participants, especially those freight parties who are executing refrigerated shipping moves, rely on SONAR indices that show reefer freight data and activity. The reasons for a carrier to reject the load tender are: 1) lack of trucking capacity; and 2) the rate is too low.
This is seen exceptionally well when looking at rail capacity and transportation rates for the modern supply chain. Data access and analysis continue to be essential to competitive operations within the process of monitoring rates and expenses in intermodal shipping lanes.
Big data and predictive freight rates in the digital supply chain are nothing new. Nearly all shippers, brokers and carriers collect and use data to derive insights, including predictive rates. Unfortunately, the most robust applications of that data will quickly diminish in value as data ages. Download the White Paper.
Transportation procurement remains a major problem for enterprises faced with the need for faster and more extensive capacity. Part of acting on them immediately derives from the size of the data collected and how it can be transformed into meaningful insights. Freight market data size consistency matters.
In this edition of “SONAR Indices & Insights,” readers will learn about FreightWaves SONAR’s Weighted Rejection Index (WRI) to monitor trucking capacity in the freight market and the impact rejections have on shipping rates. What does WRI say about capacity and shipping rates? What is the Weighted Rejection Index (WRI)?
Mobile data can play a pivotal role in building the supply value chain. Mobile devices have functions that provide valuable data for the supply value chain. But even more importantly, this freight data enables shippers to optimize their company’s operations in various ways by avoiding overspend and more.
Have you taken any steps to increase capacity utilization? Capture and analyze data inside and outside of your network to benchmark performance. The biggest barrier to efficiency in supply chain agility rests with an inability to see, capture or analyze freight data. Are you using your trucking assets as efficiently as possible?
H aving access to real-time freight data and being able to make good use of it is essential for global trade and maritime shipping. Global retailers use data to understand lead time Successful supply chain operation at any stage hangs on the ability to stay on top of shipping and transport logistics. Request a SONAR Demo.
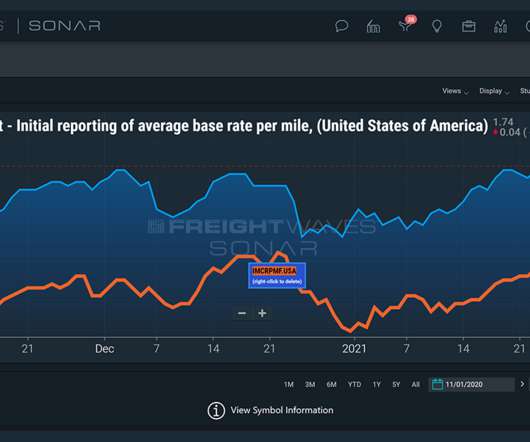
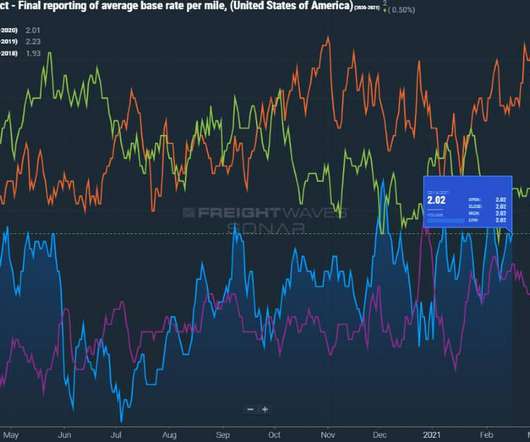
Data analytics for logistics can make all the difference in the world when it comes to reefer truckload service delivery efficiency. However, the data [that powers them] hasn’t previously been utilized to its full capacity until recently.” Take the example of RCRPMF.USA in the image. last year and $2.19 the year prior.
And that’s why it’s important for carriers to apply data and enable predictive freight rating through these five requirements. Recognize that not all loads are as lucrative as meets the eye, letting data do the talking Benchmarking may be the first step, but the next focuses on identifying the less-lucrative loads.
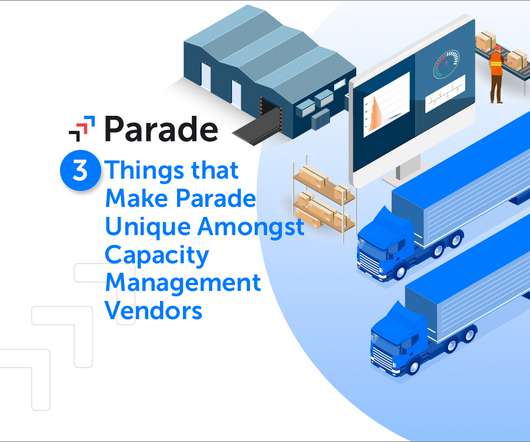
Capacity Management for Freight Agencies? This feature shines a light on Parade’s capacity management for freight agents. Here’s Why Many Capacity Management Tools Don’t Serve Freight Agencies Not too long ago, capacity management simply didn’t work for freight agencies that provide logistics solutions to their agents.
More Resources Home October 15, 2024 Update The Freightos Weekly Update helps you stay on top of the latest developments in international freight by giving you the rundown on the latest economic data, ocean and air demand trends, rate data – and anything else impacting the market. Europe weekly prices fell 1% to $3.80/kg. kg last week.
But knowing what’s happening based on historic, peer and market data can help shippers figure out how carriers price freight loads. Here are a few things managers need to keep in mind when working with real-time freight data for pricing purposes. . Contract freight may not equate to guaranteed capacity.
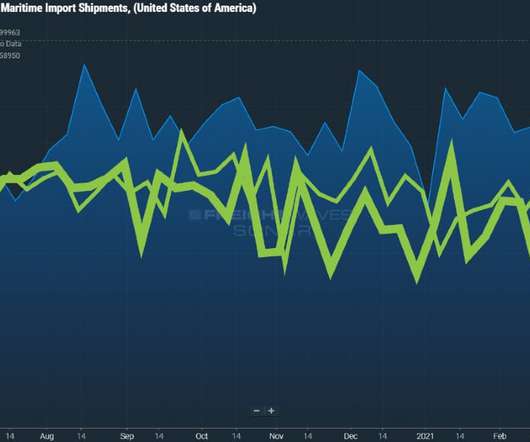
This “SONAR highlight reel,” which we plan to publish every other week, is intended to concisely hit data highlights and trends in truckload, intermodal and maritime. The end of the second quarter is typically a strong period for truckload freight and this year is no exception. Request a SONAR Demo. Request a SONAR SCI Demo.
Parade’s approach to capacity management is different from the rest in several ways. Parade is considered the top capacity management solution by most of the supply chain industry. Parade not only provides these key data points but also allows that data to be pushed to other programs to make audits and tracking easier.
More Resources Home November 19, 2024 Update The Freightos Weekly Update helps you stay on top of the latest developments in international freight by giving you the rundown on the latest economic data, ocean and air demand trends, rate data – and anything else impacting the market. Europe weekly prices increased 5% to $4.03/kg.
More Resources Home November 15, 2023 Update The Freightos Weekly Update helps you stay on top of the latest developments in international freight by giving you the rundown on the latest economic data, ocean and air demand trends, rate data – and anything else impacting the market. Freightos Air Index data shows China – N.
This “SONAR highlight reel,” which we plan to publish every other week, is intended to concisely hit data highlights and trends in truckload, intermodal and maritime. Freight volumes continue the robust growth though relative capacity has started to tighten again, following a seasonal pattern. Request a SONAR Demo.
More Resources Home March 12, 2024 Update The Freightos Weekly Update helps you stay on top of the latest developments in international freight by giving you the rundown on the latest economic data, ocean and air demand trends, rate data – and anything else impacting the market. America weekly prices fell 20% to $3.97/kg
The truckload market remains tight to start the year, both due to demand that is running ahead of year-ago levels and due to capacity that has been slow to return to the market following the holidays. In fact, our data shows that accepted tender volume is up 12% y/y. Request a SONAR Demo. Request a SONAR SCI Demo.
The sum of that freight tech volume is somewhat ironic – data overload and an inability to manage due to the inefficient use of several systems. Freight tech APIs collect data in near real-time. Connected systems can collect data in near real-time, limited only by the speed of an internet connection. Why is that advantageous?
Parade’s new feature helps brokerages find carrier capacity in every quote, even the ones they don’t use. The New Parade Feature in a Nutshell The new feature focuses on showing customers not only capacity within their current network, but also other potential capacity our system has identified. There’s no shame in it.
Parade’s new feature helps brokerages find carrier capacity in every quote, even the ones they don’t use. The New Parade Feature in a Nutshell The new feature focuses on showing customers not only capacity within their current network, but also other potential capacity our system has identified. There’s no shame in it.
This “SONAR highlight reel,” which we publish every other week, is intended to concisely hit data highlights and trends in truckload, intermodal and maritime. Spot rates continue to rise as freight flows to the spot market – particularly on the West Coast. Request a SONAR Demo. Request a SONAR SCI Demo.
More Resources Home November 7, 2023 Update The Freightos Weekly Update helps you stay on top of the latest developments in international freight by giving you the rundown on the latest economic data, ocean and air demand trends, rate data – and anything else impacting the market. Europe – N.
The freight market is always changing; that is why you need the freight forecasting platform with the most current data and insights. FreightWaves SONAR has near-real-time data – the fastest and freshest data available. Using old data in a volatile market can be very costly. Request a SONAR Demo.
We organize all of the trending information in your field so you don't have to. Join 84,000+ users and stay up to date on the latest articles your peers are reading.
You know about us, now we want to get to know you!
Let's personalize your content
Let's get even more personalized
We recognize your account from another site in our network, please click 'Send Email' below to continue with verifying your account and setting a password.


Let's personalize your content