This site uses cookies to improve your experience. To help us insure we adhere to various privacy regulations, please select your country/region of residence. If you do not select a country, we will assume you are from the United States. Select your Cookie Settings or view our Privacy Policy and Terms of Use.
Cookie Settings
Cookies and similar technologies are used on this website for proper function of the website, for tracking performance analytics and for marketing purposes. We and some of our third-party providers may use cookie data for various purposes. Please review the cookie settings below and choose your preference.
Used for the proper function of the website
Used for monitoring website traffic and interactions
Cookie Settings
Cookies and similar technologies are used on this website for proper function of the website, for tracking performance analytics and for marketing purposes. We and some of our third-party providers may use cookie data for various purposes. Please review the cookie settings below and choose your preference.
Strictly Necessary: Used for the proper function of the website
Performance/Analytics: Used for monitoring website traffic and interactions
Killing Ghost Loads and Phantom Data with Michael Darden. Michael Darden and Joe Lynch discuss killing ghost loads and phantom data. Michael is the CEO of DFM Data Corp, a utility company designed to be a tool between digital partners moving freight in the USA and Canada. About DFM Data Corp. DFM Data Corp.
Why Modern Data Warehouses Are No Longer Optional A centralized data warehouse is becoming an essential solution for businesses looking to scale efficiently and optimize operations. It’s no longer just a “nice to have,” but a critical repository for processing vast amounts of business data.
By analyzing real-time data from various sources, companies can make proactive decisions that improve collaboration among stakeholders, boost operational resilience, and increase customer satisfaction. Data privacy concerns are paramount, as AI systems rely on vast amounts of sensitive information.
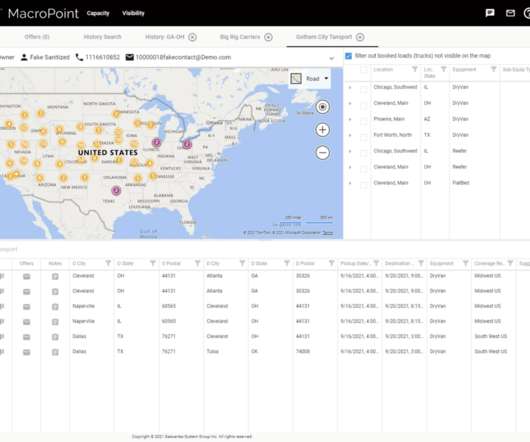
The SONAR Lane Score is now available in Descartes Macropoint Capacity. Direct access to SONAR Lane Score within MacroPoint Capacity helps brokers maximize efficiency by bringing in useful data into one platform. Descartes’ MacroPoint Capacity allows a broker to see assets throughout the U.S. freight markets by lane.
It’s not a secret that capacity remains tight and freight rates stay high. Yet, produce shippers that take the time to think about the situation and what they can do to push through will have a better chance at finding capacity and keeping costs manageable. Data from the U.S. WHAT MAKES THIS PRODUCE SEASON DIFFERENT?
This year, a recurring theme that I saw was about using supply chain data to improve the customer experience across the entire value chain. Here are the ones that stood out to me, especially as it relates to supply chain data. The single data cloud runs on Snowflake, one of Blue Yonder’s partners.
Increasing supply chain data visibility is a priority for logistics organizations looking to improve resilience. Supply chain recovery hinges on incorporating robust data analytics and other data-driven tools into business operations to increase efficiency, reduce costs and proactively manage risk.
An iGPU (integrated graphic processing unit) is a current example. We have all the connected planning data we get from blue Yonder, all of the product data we get from the product systems, all of the shipment information that’s coming in from the carriers, as well as risk information from Everstream and other sources.
It’s no secret that capacity gets tighter and freight rates higher for all shippers during produce season. Yet, produce shippers that make use of these suggested tips have a better chance of finding capacity and keeping their costs manageable. Fighting tight capacity and high freight rates? Shipping temperature-sensitive items?
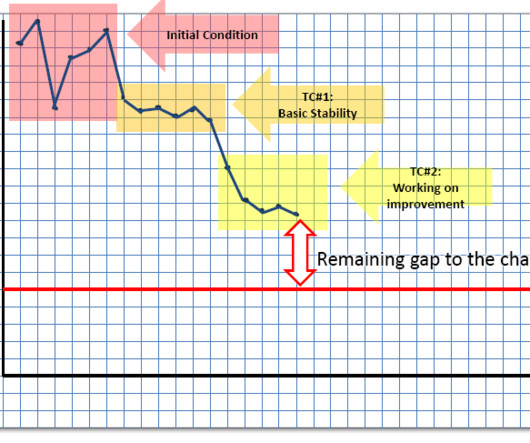
T oyota Kata Culture by Gerd Aulinger and Mike Rother offers a good example of this. This is a video of Gerd’s presentation to Kata School Cascadia on the process of developing problem-solving capacity and cascading goals. On the left is the conversation a manager / coach might have with the supervisor of the stamping area.
This week, learn how freight market participants, especially those freight parties who are executing refrigerated shipping moves, rely on SONAR indices that show reefer freight data and activity. The reasons for a carrier to reject the load tender are: 1) lack of trucking capacity; and 2) the rate is too low. RHAUL.ATL = 50.
Carrier capacity tops the list of parcel shippers’ challenges. E-commerce order volume keeps climbing, straining carrier capacity with shippers sending more parcels outbound and receiving more returns inbound. Carrier capacity management strategies ease the crunch. Widening our view of carrier capacity management.
Simplify, Synchronize, Succeed Gain consolidated visibility into rates, capacity, and market shifts. The fragmentation of data and processes was creating blind spots, inefficiencies, and ultimately, vulnerability to disruption. At Freightos, we’ve invested heavily in providing near real-time or real-time data to our customers.
Supply chain intelligence and actionable insights must apply the most accessible, near real-time data available. Analytic data resources for brokers are great, but it’s equally important to realize that FreightWaves SONAR is much more than a broker-exclusive resource. Market dynamics of freight management can turn on a dime.
Or they may have expertise in manufacturing processes and have flexible capacity to allow contract manufacturing for new product introduction. An example of this is Vendor Management Inventory and Capacity Collaboration for contract manufacturing.
For example, our advanced 3PL platform looks after every aspect of your supply chain in an efficient, effective way and our Virtual Carrier Network safeguards your shipping by always applying the best rates and speeds while not handcuffing you to any carrier. Of course we’re talking about your ecommerce store’s data security.
Understanding what consumers want With billions of dollars of orders poised to test the capacity of retailers’ shipping operations this peak season, minimizing fulfillment uncertainty and transforming customer confidence through optimized last mile delivery becomes priority one.
Meeting today’s logistics challenges of the three C’s – customer service, carbon, and cost – companies are not just looking at gathering data, but also how to better interpret and understand this data, and then use it to drive additional value. Analyze and track your carbon footprint using logistics data.
Quality and Detail of Data and its Analysis In some of our earlier posts, weve stressed the importance of simplicity in distribution network design , and we will return to that topic later in this article. It would be folly not to take advantage of data availability and accessibility.
Here are 10 shipper of choice tips to help enterprises secure capacity and improve relationships with carriers, not to mention transportation brokers. The best examples of shippers of choice provide services along several trucking routes. Respond to issues, deviations and problems with data. Request a SONAR Demo.
They can ingest large volumes of functional data and leverage advanced intelligence to recognize broad trends and specific disruptive events. They are applying predictive analytics and data science to choose an optimal response quickly, driven by facts and pre-defined business outcomes. billion to $23.07
Strong Carrier Relationships : Our long-standing relationships with ocean carriers ensure that we secure priority space for your shipments, even when capacity is tight due to hurricane-related rerouting or congestion. This proactive approach helps you avoid costly delays and keep your operations running smoothly.
Shortages of drivers is just one of the contributors to the difficulties shippers are having in securing the truck capacity they need. The carrier driver shortage has resulted in shippers tendering loads to their 2nd, 3rd, or 4th best choice on a lane due to the capacity crunch. The spot market has become more popular as a result.”.
Bipartisan Infrastructure Laws Impact The Bipartisan Infrastructure Law is driving improvements in freight infrastructure, including: Expansion of port capacity to accommodate increasing container traffic. Labor and Capacity Shifts As more freight moves through regional networks, driver demand shifts accordingly.
By embracing collaboration, real-time data, and a focus on sustainability, companies can build resilience, improve margins, and gain a competitive edge. Top Challenges Faced by Companies: Customer Preferences: Example: An online fashion retailer faces the challenge of constantly changing customer preferences.
What are some examples of Supply Chain Automation? Predictive Analytics and Demand Forecasting – Modern supply chain systems analyse historical data, market trends and even weather patterns to predict future demand. This means you can keep optimal inventory levels and avoid stockouts and overstocking.
“Of course, you can build more tracks and there are places in the Netherlands where it would be easy to do this, but in areas like the Randstad conurbation, where extra capacity is needed most, it’s going to be difficult,” said Pier Eringa, CEO of ProRail in an article on the railway’s efforts to boost capacity and speed.
Leading organizations are building supply chains that are less exposed to single points of failure, more informed by real-time data, and more able to adjust sourcing, inventory, and routing based on current conditions. The Shift Toward Resilience The strategic conversation is beginning to shift. What if lead times from a key port double?
The data around Singles’ Day is staggering. Many rented extra storage capacity and hired additional trucks and delivery drivers as goods leaving the warehouses came in wave after wave. For example, a system such as the 3D vertical sorter from Libiao Robotics enables retailers to handle exceptional volumes of items even at peak times.
Planning applications don’t work well if the master data they rely on is not accurate; this is known as the “garbage in, garbage out” problem. Artificial intelligence is beginning to be used to update the data. Lead times, for example, are a critical form of master data for planning purposes.
Organizations must take the following steps to bring departments together to create truly resilient and sustainable supply chains: Leverage external data to sense market shifts Look to external causal factors and forecasting models to identify market shifts. Supply chain design can help identify and flag such capacity and capability gaps.
Likewise, opacity creates inefficiency : it either lets capacity go to waste or leaves money on the table by underselling a valuable commodity. Passenger air travel is another good example. . Other industries have leveraged this digital shift. In every case these have not only optimized an existing market but expanded the market.
More Resources Home June 4, 2024 Update The Freightos Weekly Update helps you stay on top of the latest developments in international freight by giving you the rundown on the latest economic data, ocean and air demand trends, rate data – and anything else impacting the market. Europe – N. America weekly prices fell 2% to $1.7/kg.
Second, what is autonomous planning in supply chain, and what are some practical examples? These decisions are made in a synchronized manner, using real-time or near real-time data, AI/ML and optimization technology, while having the humans setting the goals and managing the parameters. Below are some key points from our discussion.
The next generation of solutions could also plan and configure loads based on packaging dimensions and the capacity of vehicles. A route planning application that integrates with enterprise mobility to collect vehicle-tracking data will be helpful for comparing actual performance of individual routes against the planned versions.
Some examples of these are: U.S. Many other countries, refer to ICH guidelines gathering data on a product’s safety and efficacy to establish a cold chain strategy. ICH brings together many regulatory authorities to discuss data and establish those guidelines. TEMPERATURE-CONTROLLED SHIPPING CAPACITY. In the U.S.,
Air cargo for example, though continuing to make digital strides, is still behind – and is often compared to – passenger travel where digitized capacity, pricing and online bookings have been around for decades and is in some ways the digitalization template air cargo is referencing.
AI-Powered Optimization for Port Operations Data-Driven Decision-Making: AI algorithms analyze historical data, real-time information, and external factors to optimize port operations. For example, if a vessel is delayed due to adverse weather, port operators can adjust resource allocation accordingly.
A fleet management system is used to plan a business’s logistics based on an assessment of historical delivery data and to monitor the performance of each vehicle based on tracking technologies such as GPS and telemetry sensors. Two of the most common measures are average delivery time and assessment of fleet vehicle capacity.
1) Streamlined Data Flow and Process Automation Is all about AI At the heart of effective supply chain automation lies the seamless flow of data across various sources and digital platforms, akin to a well-constructed highway for data. 2) AI-Infused Data Quality Assurance Ok, we built the proverbial highway.
More Resources Home December 6, 2023 Update The Freightos Weekly Update helps you stay on top of the latest developments in international freight by giving you the rundown on the latest economic data, ocean and air demand trends, rate data – and anything else impacting the market. Freightos Air Index data show that China – N.
With the carrier capacity crunch and other challenges looming large, seamlessly fulfilling all those orders will be no easy task for many merchants. Carriers have imposed widespread shipping capacity limitations. Prioritize peak season prep with parcel shipping data. The right now solution. Many unprepared U.S.
Emerge has an interesting new platform to deal with the problems shippers are having procuring truck capacity. For example, if a shipper needs to ship goods from Chicago to Detroit, the TMS will have a record that on this lane, the transportation planner should contact Carrier A first. Emerge is that kind of company.
There are a variety of external data streams that also play a role in providing better visibility and improved ETAs. Companies are partnering with data aggregators to get a better idea of when shipments will arrive. However, the nuances and granularity of the data will vary depending on the mode. Real-Time Visibility Data.
We organize all of the trending information in your field so you don't have to. Join 84,000+ users and stay up to date on the latest articles your peers are reading.
You know about us, now we want to get to know you!
Let's personalize your content
Let's get even more personalized
We recognize your account from another site in our network, please click 'Send Email' below to continue with verifying your account and setting a password.


Let's personalize your content