This site uses cookies to improve your experience. To help us insure we adhere to various privacy regulations, please select your country/region of residence. If you do not select a country, we will assume you are from the United States. Select your Cookie Settings or view our Privacy Policy and Terms of Use.
Cookie Settings
Cookies and similar technologies are used on this website for proper function of the website, for tracking performance analytics and for marketing purposes. We and some of our third-party providers may use cookie data for various purposes. Please review the cookie settings below and choose your preference.
Used for the proper function of the website
Used for monitoring website traffic and interactions
Cookie Settings
Cookies and similar technologies are used on this website for proper function of the website, for tracking performance analytics and for marketing purposes. We and some of our third-party providers may use cookie data for various purposes. Please review the cookie settings below and choose your preference.
Strictly Necessary: Used for the proper function of the website
Performance/Analytics: Used for monitoring website traffic and interactions
That information then leads to improved rates, capacity, and several other benefits. And it’s part of the reason that more enterprises are considering the historical accuracy of analytics, particularly freight rates, such as the exact findings presented by the newer FreightWaves Scientific tickers. Request a SONAR Demo.
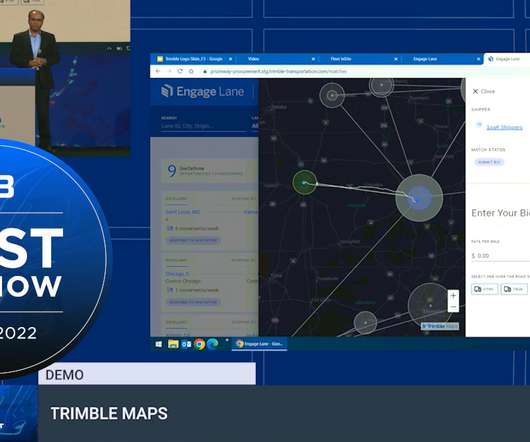
During the event, Rishi Mehra, director of operations and strategy, and Kelly Williams, product manager, had just seven minutes to present a Rapid-Fire Demo of Engage Lane: an agile transportation procurement platform that streamlines the relationship between carriers and shippers and helps them uncover better ways to move freight.
With the proper use of data and freight analytics , contract procurement and securing capacity can be enhanced. Lacking data promotes trouble in annual contract capacity procurement during times of volatility. Using analytics will save time and help avoid problems securing LTL freight rates and capacities by pointing out opportunities.
The significance of this region’s having the most elevated rejection rates is simply that it is breaking a multiyear pattern of relatively loose capacity conditions and minimal volatility. While capacity remains abundant in the domestic freight market, the flow of freight is not balanced. To request a SONAR demo, click here.
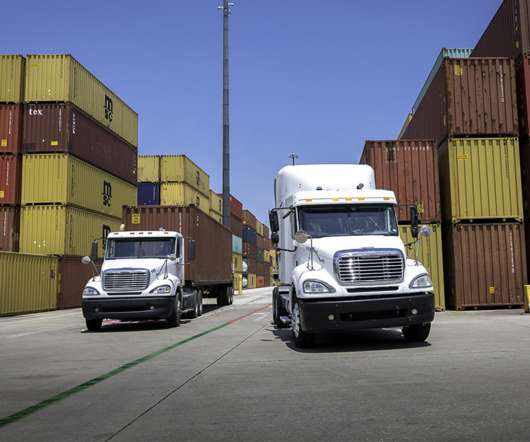
Many LTL industry trends, including capacity limitations, increasing accessorials, surcharge rates, changes in market trends and buying patterns, are almost certain to continue through 2021 and for some time to come. Major shippers and transporters have only so much space available to work within LTL shipping capacity.
However, increasing freight management efficiency can come in several different forms and can present a difficult challenge. And part of that includes recognizing when existing contracts fall short and when to re-enter mini-bids, significantly as capacity tightens, says the Loadstar. Request a SONAR Demo.
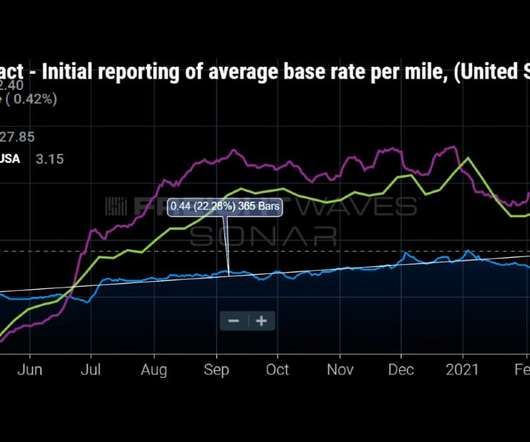
National van truckload tender rejection rates — the percent of electronic requests for capacity declined by carriers — have exceeded 20% since early August outside of a single day in February. This indicates demand continues to outpace capacity and many of the recently implemented contracts have been unsuccessful.
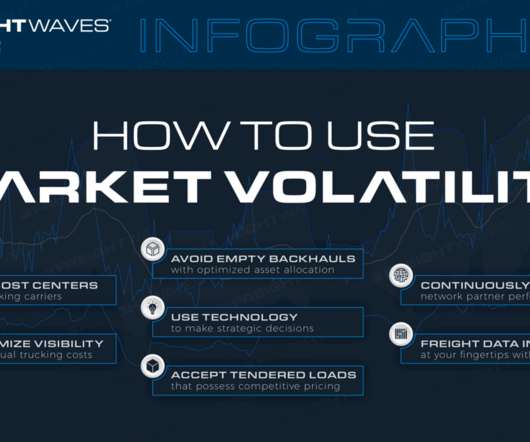
Market volatility insight presents value to carriers that learn to recognize how trends lead to challenges and why those challenges represent opportunities for improvement. These trucking costs all present an ongoing concern for carriers, and unless carriers are prepared, they will lose sight of the bigger picture.
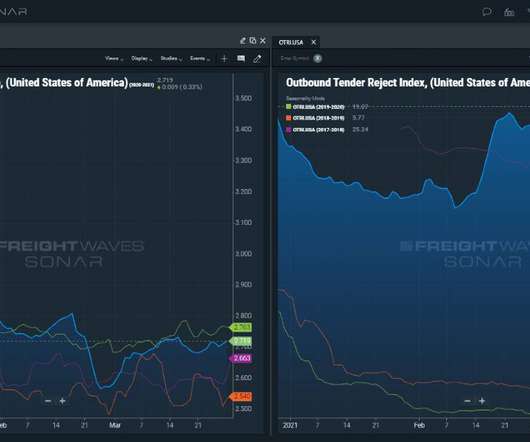
This is done by presenting in-depth insights in an effective manner, such as with an easy-to-view ticker lineup, such as seeing OTLT.USA compared to OTRI.USA side-by-side, but that can only go so far in helping to alleviate concerns with routing guide compliance. Request a SONAR Demo. Request a SONAR SCI Demo.
The answer lies in how shippers present the information to carriers – indicating how carriers can benefit from tapping backhaul opportunities in in-demand markets. After all, import activity is one of the leading indicators of added pressure on truckload logistics and sourcing capacity. Request a SONAR demo online today.
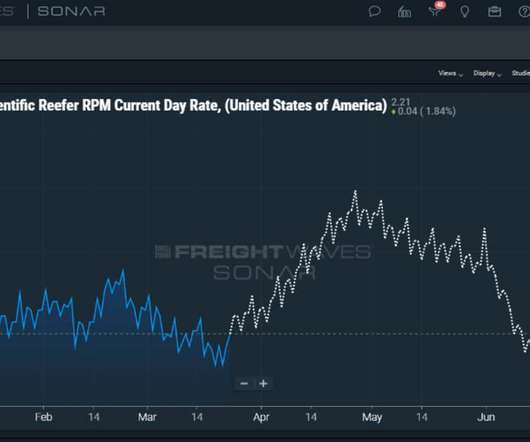
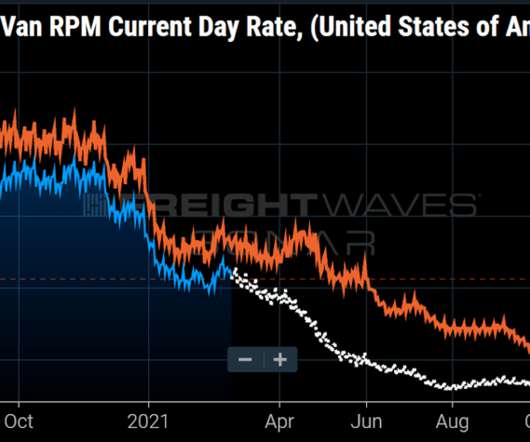
As dry van capacity has somewhat started to recover, reefer capacity has become even more scarce as national reefer rejection rates once again hit an all-time high, topping 50% this past week. Somewhat surprisingly, this capacity crunch is located largely in areas that the storm did not directly affect, such as Southern California.
As e-commerce peak season ramps up, more organizations will see available drivers and capacity dwindle. Without supply chain visibility, a retailer cannot realistically move freight to other markets to take advantage of trucking capacity. Request a SONAR Demo. Thus, rates are going to continue climbing.
And disruption continues to evolve and present new challenges, including a misplaced perception that digital technology will threaten such companies’ success. Capacity is finite. Request your SONAR demo by clicking the button below now! Request a SONAR Demo. However, that is not all bad. SONAR makes that possible.
Let’s take a closer look at how such an analysis provides more actionable insights that help shippers find and leverage meaningful capacity. For any supply chain management team to make the most of transportation cost analysis, there remain several key components that must be present. Request a SONAR Demo.
Last-Mile Delivery Challenges The last mile of the delivery process —the journey from a transportation hub to the final delivery location—presents unique challenges that require meticulous planning and adaptability. Effective scheduling defines capacity by zone or zip code, considering truck volume, number of stops, and service time.
For instance, both CVS and Academy both present their routing guides online for easy access. Request a FreightWaves SONAR SCI Lane Acuity demo to get started or by clicking the button below. Request a SONAR Demo. Request a SONAR SCI Demo. Routing guides are a universal source of carrier freight tendering and action.
And it also presents the opportunity to make more money by aligning freight rates accordingly as well. Also, fewer drivers limit available capacity, and since less capacity for freight amounts to added delays in shipping, Jim Beach of TruckingInfo , wrote that carriers will charge more for their drivers. Request a SONAR Demo.
Knowing exactly the free storage space available as well as the location of your parts gives you the possibility to use capacity more efficiently and to route your logistics flexibly,” he said. Medical and related supply chains, presently under considerable stress, may benefit as well. .
This presents a huge challenge for enterprise shippers who have not embraced modern technology and freight tools. For instance, increased or decreased ocean import activity will contribute to higher demand for short-term capacity in ports of higher activity. Get started by requesting a FreightWaves SONAR demo via the button below. .
Driver to non-driver ratio = active driver count / non-driver count Percentage of driver turnover (DRVTO) With all the pressure discussed over limited capacity, it’s important not to overlook the role of trucker shortages or turnover. Request a SONAR Demo. In a sense, this is a driver utilization aspect of trucking freight KPIs.
The integration of drone technology holds the potential to revolutionize how businesses approach pest management, presenting both opportunities and considerations. GET A FREE DEMO Challenges and Limitations of Drone Usage Drones for pest control offer significant potential, yet face a range of challenges and limitations.
Hunt’s business, as well as Dedicated Contract Services and Integrated Capacity Solutions, the company’s brokerage arm, combine to represent 86% of the company’s revenue and 91% of its operating income. This backdrop presented a bright outlook for carriers during the first two months of 2022. Request a SONAR Demo.
Becoming one with the other office systems : Just like word processor, spreadsheet and presentation started out as separate applications and merged to become one single office system, today’s TMS applications are evolving to become one with the office system. Therefore, they should adopt TMS as soon as they can.
The benefits of these systems are managing transportation costs and navigating capacity crunches. Some of the TMS in larger companies focus on things like managing a capacity crunch and optimizing their freight for transportation across various modes. Want A Free BlueShip TMS Demo? The next step up is mid-sized shippers.
A contract is considered legally binding when certain factors are present. The five essential requirements that must be met to form a legally binding contract are consideration, acceptance, intention, capacity, and legality. Capacity refers to the legal ability of the parties involved to enter into a contract.
The benefits of these systems are managing transportation costs and navigating capacity crunches. Some of the TMS in larger companies focus on things like managing a capacity crunch and optimizing their freight for transportation across various modes. Want a free BlueShip Demo? Request a BlueShip Demo.
Additionally, there is an increase in general road toll tariffs, which varies according to the vehicle's weight capacity, number of axles, and emission class. To find how, request a demo today. Notably, zero emission vehicles are exempt from the truck toll until 2026. To find out more about New API parameter read release notes here.
Or it could be a conference presentation or webinar your prospect just delivered. . Go through this information carefully; it will give you numerous clues how to position your sales presentation to align with how it serves your prospect’s customers. . #2: Request a SONAR Demo. 2: Company news. 6: Podcasts/Webinars/Television .
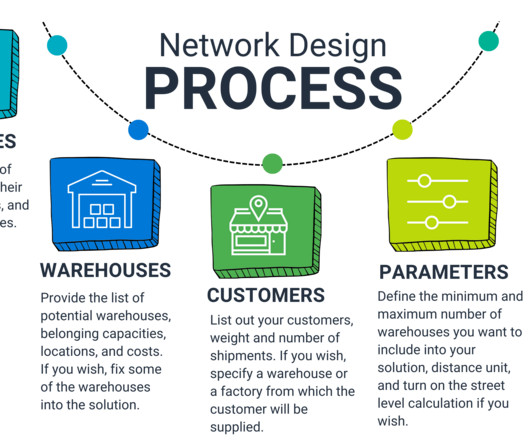
“ To summarize, here’s the data required for the Network Design App: Your Factories: Provide their locations, costs, and truck capacities. List of Potential Warehouses: Include locations, capacities, costs, and indicate if a warehouse can be fixed in the solution. Here is where you can book a call with us.
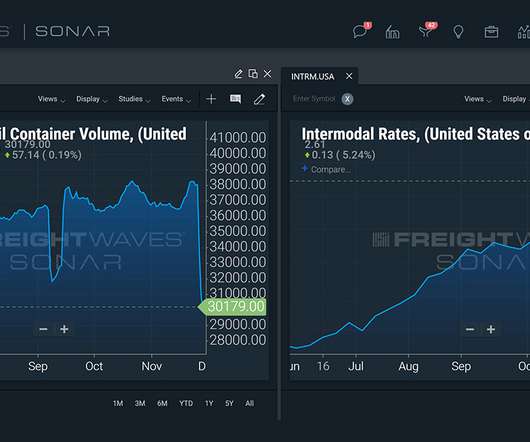
Brokers : Brokers can utilize loaded container volume (ORAILL/IRAILL) to gain visibility into which locations they can broker intermodal shipping loads in addition to truckloads and where they might be able to source capacity cheaper in the intermodal market. Get a demo of SONAR to see what the platform can do for you.
We are witnessing a technological revolution as the freight industry finally moves to the present age. It’s the capacity of both the storage and the ability to share data that will be the driving force behind the revolution of the transportation industry. Fill out the form below to request a free demo today:
This presents a lucrative opportunity for logistics companies such as retail, e-commerce, and other logistics providers. Delivery-linked checkout: With its delivery-linked checkout, Locus’ dispatch management software collects the preferred time slots of customers and syncs them to capacities. billion US Dollars by 2027.
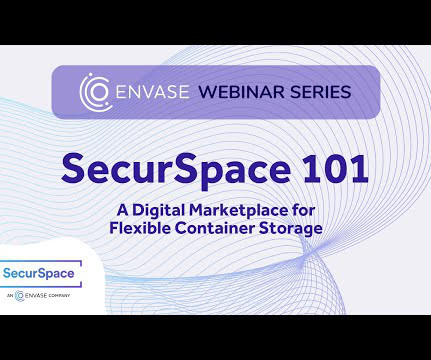
TruckersHelpTruckers: SecurSpace serves as a community that connects those in need of storage with facilities that have extra storage capacity. For a quick demo, jump to 16:20 in the webinar recording to watch Bobby walk through it! SecurSpace promotes pricing transparency by presenting a range of rates across its network of locations.
Often, when decision-makers invest in a supply chain management solution, they focus on present-day challenges, overlooking the potential future growth of their company. No Customized Delivery Solutions: SMBs usually lack smart capacity allocation for personalized delivery windows. Experience the transformation Locus offers.
While there’s no shortage of 3PLs, choosing the right carrier presents a challenge for shippers. However, by leveraging a smart customer experience and dispatch management platform like Locus, shippers can plan deliveries based on automated capacity management, which takes into account routing issues, cancellations, and returns.
Many a junior executive presented to him what they thought were good results only to be humbled when shown that their input metrics - the foundation of their future business - were shaky. At Parade, we offer a capacity management platform. Auditing Your Vendors.
Many a junior executive presented to him what they thought were good results only to be humbled when shown that their input metrics - the foundation of their future business - were shaky. At Parade, we offer a capacity management platform. Auditing Your Vendors.
Knowing if spot rates are expected to climb or decline can help users make more accurate decisions for either acquiring or pricing capacity in the near-term. . Sign up for a demo here or by clicking the button below. Request a SONAR Demo. Value of the FreightWaves Scientific Rates for each freight market segment.
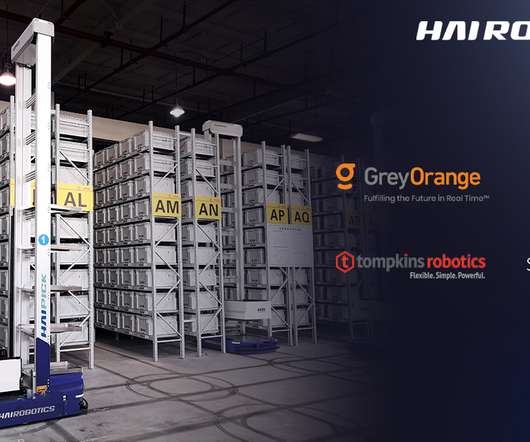
HAI ROBOTICS , a pioneer in Autonomous Case-handling Robot (ACR) systems for warehouse logistics, will present its highly flexible totes-to-person warehouse automation solution at this year’s MODEX 2022 show, Booth C4585 at Georgia World Congress Center in Atlanta from March 28th to 31st.
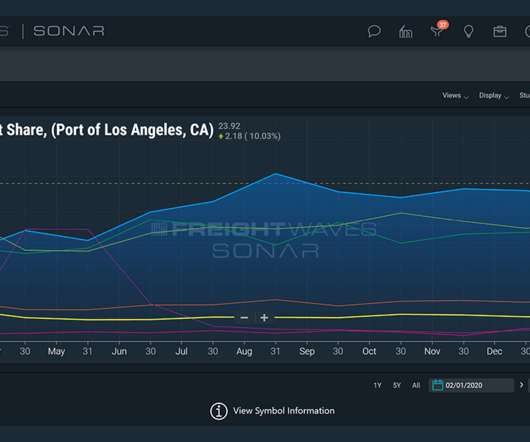
The time period for the SONAR chart is from January 2020 to the present. When that market does flip, the inbound volume will cause an uptick in Houston’s import market share and overall import volume, leading to a lack of trucking capacity in the area. Request a SONAR Demo. Request a SONAR SCI Demo.
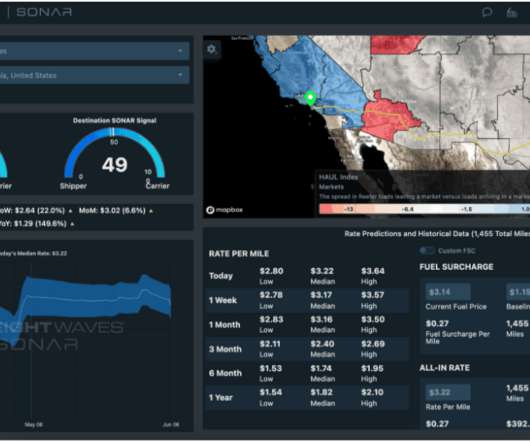
In addition, SONAR uses artificial intelligence to develop consistently updated forecasts to give subscribers the most reliable predictions of where trucking spot rates, supply chain demand and logistics capacity are headed over the next 12 months. Values above 50 indicate demand outpaces supply and below 50 suggests there is excess capacity.
By imbibing nuances of volatility, real-world constraints, fleet capacities, and the knowledge gained by on-ground personnel, routes devised are pro driver. Schedule a Demo The post Artificial Intelligence: Key to Improved Route Adherence & Driver Experiences appeared first on Locus Blog.
Retailers with deep pockets may have access to a separate SCM suite that takes care of most of supply chain operations, including optimizing capacity and routing to cater to custom delivery demands of customers. One of its standout features is the delivery-linked checkout, synchronized with capacity-based slot bookings.
Decarbonization, which means reducing the amount of carbon in greenhouse gas emissions, can help in improving our present condition. The latter was so severe that cargo ships had to run at half their usual capacity. Try a demo with Locus to achieve sustainability for your logistics. Schedule Demo.
We organize all of the trending information in your field so you don't have to. Join 84,000+ users and stay up to date on the latest articles your peers are reading.
You know about us, now we want to get to know you!
Let's personalize your content
Let's get even more personalized
We recognize your account from another site in our network, please click 'Send Email' below to continue with verifying your account and setting a password.


Let's personalize your content