This site uses cookies to improve your experience. To help us insure we adhere to various privacy regulations, please select your country/region of residence. If you do not select a country, we will assume you are from the United States. Select your Cookie Settings or view our Privacy Policy and Terms of Use.
Cookie Settings
Cookies and similar technologies are used on this website for proper function of the website, for tracking performance analytics and for marketing purposes. We and some of our third-party providers may use cookie data for various purposes. Please review the cookie settings below and choose your preference.
Used for the proper function of the website
Used for monitoring website traffic and interactions
Cookie Settings
Cookies and similar technologies are used on this website for proper function of the website, for tracking performance analytics and for marketing purposes. We and some of our third-party providers may use cookie data for various purposes. Please review the cookie settings below and choose your preference.
Strictly Necessary: Used for the proper function of the website
Performance/Analytics: Used for monitoring website traffic and interactions
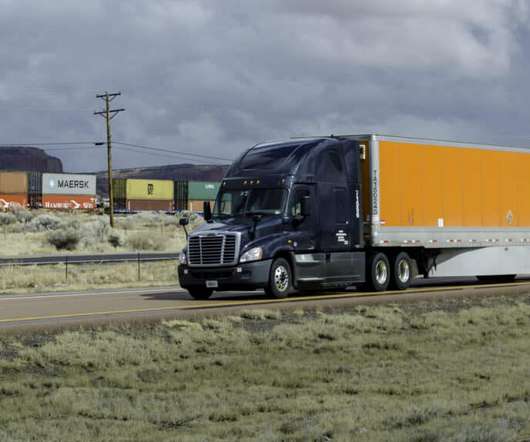
A risk to that outlook is the potential for the Asian energy crisis to disrupt manufacturing capacity The truckload peak season starts later than the other modes and the recent decline in demand (from a very high level) at the beginning of the fourth quarter is seasonally typical. FILL OUT THE FORM BELOW TO DOWNLOAD THE FREE WHITEPAPER.
Elevated import volume, inventory replenishment and capacity constraints are likely to keep the truckload market tight, but it is hard to see a catalyst that will make it incrementally worse from a shippers’ perspective. FILL OUT THE FORM BELOW TO DOWNLOAD THE FREE WHITEPAPER. Request a SONAR Demo.
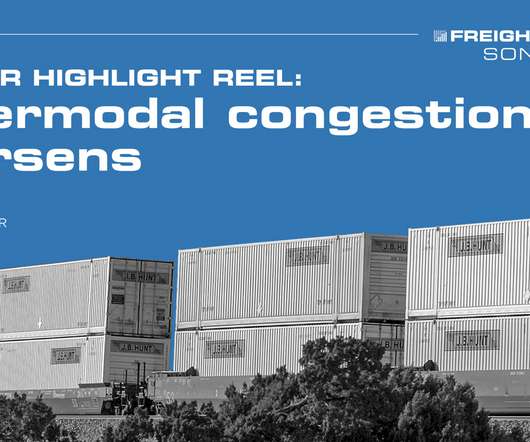
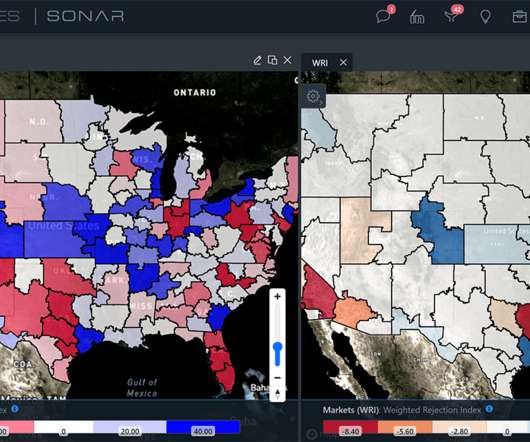
Freight volumes continue the robust growth though relative capacity has started to tighten again, following a seasonal pattern. Further complicating matters for shippers, a COVID outbreak at one terminal at the Port of Ningbo, the world’s third-largest container port, has reduced its capacity to 80%. Request a SONAR Demo.
Capacity constraints remain in place, although conditions have improved over the past year. Unfortunately, international intermodal volume is falling due to the many capacity constraints. FILL OUT THE FORM BELOW TO DOWNLOAD THE FREE WHITEPAPER. Request a SONAR Demo. Request a SONAR SCI Demo.
highlight a still-tight capacity environment for shippers. FILL OUT THE FORM BELOW TO DOWNLOAD THE FREE WHITEPAPER. Request a SONAR Demo. Request a SONAR SCI Demo. The post [WHITEPAPER] SONAR highlight reel: Truckload demand stabilizes; 4Q surge may be forthcoming appeared first on SONAR.
View the Full WhitePaper. The capacity situation remains difficult as one in five tenders is being rejected by carriers. Request a SONAR Demo. Request a SONAR SCI Demo. The post [WHITEPAPER] SONAR highlight reel: Contrary to typical seasonality, intermodal volume rises in Nov. is nearly 19 days. .
View the Full WhitePaper. The truckload market remains tight to start the year, both due to demand that is running ahead of year-ago levels and due to capacity that has been slow to return to the market following the holidays. Request a SONAR Demo. Request a SONAR SCI Demo.
To help freight managers and transportation service providers grow more strategic, this whitepaper will explore the top three consequences of uncertainty in the trucking carrier market outlook, including: The problem with capacity in a post-peak amid e-commerce growth. Request a SONAR Demo.
Shippers’ requests for capacity are down mid-double digits in the past week, thanks to the Labor Day holiday. Even with the holiday, securing capacity is still extremely difficult as the dizzying high spot rates prove. FILL OUT THE FORM BELOW TO DOWNLOAD THE FREE WHITEPAPER. Request a SONAR Demo.
Elevated import volume, inventory replenishment and continued capacity constraints are likely to keep the truckload market tight, but with carriers rushing to add capacity, conditions are unlikely to get worse for shippers. FILL OUT THE FORM BELOW TO DOWNLOAD THE FREE WHITEPAPER. Request a SONAR Demo.
The free whitepaper, Peak Season Forecast: Another truckload capacity crunch , highlights SONAR data to show how we believe peak season will manifest. FILL OUT THE FORM BELOW TO DOWNLOAD THE FREE WHITEPAPER. Request a SONAR Demo. Request a SONAR SCI Demo. appeared first on SONAR.
We often demo SONAR to customers that want to see every domestic freight dataset we have to offer while showing little interest in our ocean data. FILL OUT THE FORM BELOW TO DOWNLOAD THE FREE WHITEPAPER. Request a SONAR Demo. Request a SONAR SCI Demo.
Capacity constraints remain in place with no signs of easing in Q4. Capacity is being re-routed to the trans-Pacific, which is fueling congestion while demand hasn’t wavered. FILL OUT THE FORM BELOW TO DOWNLOAD THE FREE WHITEPAPER. Request a SONAR Demo. Request a SONAR SCI Demo.
While that may be too soon to call, it’s clear that these are trying times for shippers and brokers that purchase ocean capacity. import boom that has collided with far more impactful ocean capacity constraints. FILL OUT THE FORM BELOW TO DOWNLOAD THE FREE WHITEPAPER. Request a SONAR Demo.
While tender rejection rates have declined from recent highs (to below 23%), we attribute that primarily to contracts being re-priced at sharply higher rates rather than any meaningful loosening of capacity. FILL OUT THE FORM BELOW TO DOWNLOAD THE FREE WHITEPAPER. Request a SONAR Demo. Request a SONAR SCI Demo.
In the coming days, we expect demand metrics and spot rates to hit fresh highs and we also expect a spike in tender rejection rates as capacity tightens. FILL OUT THE FORM BELOW TO DOWNLOAD THE FREE WHITEPAPER. Request a SONAR Demo. Request a SONAR SCI Demo.
The combination of SONAR and SCI allows for shippers to take advantage of numerous datasets measuring volumes and capacity in particular markets as well as the desirability of entering destination markets. FILL OUT THE FORM BELOW TO DOWNLOAD THE FREE WHITEPAPER. Request a SONAR Demo. Request a SONAR SCI Demo.
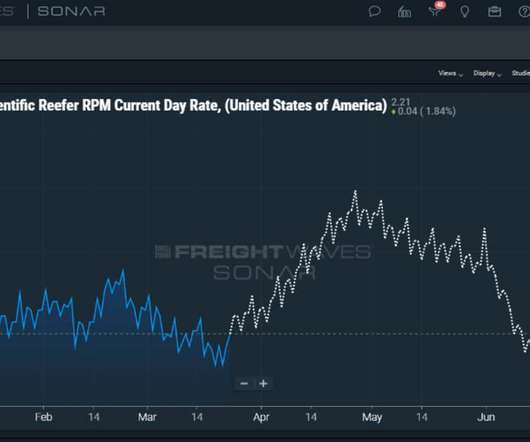
View the Full WhitePaper. The newly published spot rates represent an assessment of the prior day’s average buy rate (rate that brokers are paying to carriers for capacity). Request a SONAR Demo. Request a SONAR SCI Demo. FreightWaves released the Trusted Rate Assessment Consortium (TRAC) spot rates last week.
In addition, the pressure to operate efficiently and use capital and manufacturing capacity frugally will remain unrelenting.” And to help carriers achieve that goal, this whitepaper will explore a few best practices to reduce operating costs, including: The importance of meaningful data capture. Request a SONAR Demo.
Meanwhile, import volume remains well above year-ago levels and ocean capacity constraints have put tremendous pressure on ocean rates, particularly from China to North America. FILL OUT THE FORM BELOW TO DOWNLOAD THE FREE WHITEPAPER. Request a SONAR Demo. Request a SONAR SCI Demo. East Coast and the U.S.
View the Full WhitePaper. Tender rejection rates continue to decline but the OTRI above 19% highlights a still-tight capacity environment for shippers. Request a SONAR Demo. Request a SONAR SCI Demo. The post [WHITEPAPER] SONAR highlight reel: Still waiting on 4Q truckload demand surge appeared first on SONAR.
Leveraging electronic tender data contained in SONAR, this report illustrates how the domestic flatbed market has tightened during the past year, going from its status as perhaps the loosest domestic transportation segment to become as tight, or tighter, than the dry van market, a segment that remains characterized by scarce capacity.
The free whitepaper, Data in the fast lane – managing automotive logistics amid component shortages, shows how real-time data can enhance decision-making around the supply chain. Understand where intermodal conversion makes sense given tight truckload capacity. FILL OUT THE FORM BELOW TO ACCESS THE FREE WHITEPAPER.
Download the WhitePaper. To survive trends like these and to cut costs as much as possible without cutting quality or losing capacity, changes must occur. It is vital that shippers analyze freight capacity, how the market impacts shipping rates , and use supply chain technology and innovations. Request a SONAR Demo.
Here are 10 shipper of choice tips to help enterprises secure capacity and improve relationships with carriers, not to mention transportation brokers. Download the WhitePaper. Get started by clicking the button below to request a FreightWaves SONAR demo today. Request a SONAR Demo.
Successful freight brokerages combine networking and business skills to add capacity through carrier sourcing to secure more customers’ loads. It’s that simple, and a dynamic RFP guide helps companies leverage mini-bids to reduce capacity loss when market shifts occur unexpectedly. Download the WhitePaper.
That information then leads to improved rates, capacity, and several other benefits. Near-real-time data enables predictive modeling of rates, capacity, volumes and rejections. Real-time freight data allows for better predictive modeling of rates, capacity, volumes and tender rejections. Download the WhitePaper.
Shipping managers continue to struggle with capacity procurement during this time of industry-wide disruption . Poor capacity acquisition comes down to poor communication and freight contracts negotiation due to outdated methods. Download the WhitePaper. Request a SONAR Demo. Deadhaul miles rack up shipping costs.
Among enterprise companies, one critical aspect of successful negotiation and capacity procurement is a better predictive outlook of both spot and contract truckload rates. Enterprise shippers naturally want to secure the most cost-effective capacity for their freight loads. Download the WhitePaper. Request a SONAR Demo.
With the proper use of data and freight analytics , contract procurement and securing capacity can be enhanced. Lacking data promotes trouble in annual contract capacity procurement during times of volatility. Using analytics will save time and help avoid problems securing LTL freight rates and capacities by pointing out opportunities.
A great deal of the cost that goes into shipping gets tied up in securing load capacity and budgeting for fees and expenses incurred along the way. Ensuring capacity to secure more drivers and their corresponding bids often comes down to understanding current transportation rate fluctuations and consumer demands. Request a SONAR Demo.
Most importantly, they will provide premium service when “freight demand outstrips available capacity,” according to Coyote Logistics. These larger networks can easily travel longer distances and get to locations when smaller freight carrier providers may struggle with either capacity or access. Download the WhitePaper.
Download the WhitePaper. Limited capacity. Limited freight capacity also creates problems for asset-based trucking carriers. Limited capacity means that truckload and delivery times suffer. This makes it all the more critical, especially during crises, for shippers to plan for limited capacity.
Digital freight matching is growing more valuable as a way to source meaningful capacity Companies and freight managers that have embraced digital technology and automation remain more likely to thrive. Using digital freight matching platforms is the best strategy to secure meaningful and practical capacity. Download the WhitePaper.
Load capacity limits play a crucial part in a supply chain network organization, logistics metrics management, and procurement in the shipping industry. Managers spend a great deal of time looking for trucking capacity , including multi-modal options, to handle freight transportation needs. Download the WhitePaper.
Many LTL industry trends, including capacity limitations, increasing accessorials, surcharge rates, changes in market trends and buying patterns, are almost certain to continue through 2021 and for some time to come. Major shippers and transporters have only so much space available to work within LTL shipping capacity.
As a result, transportation fleets must leverage truck utilization data daily as well as load percent capacity, driver wellness and other KPIs to monitor the efficiency and optimization of each unit. Download the WhitePaper. Request a FreightWaves SONAR demo by clicking the button below to get started. .
Trucking capacity is tight, and deadheading is the precursor of even stricter capacity. Download the WhitePaper. Problems arise when companies cannot respond to order requests, capacity opportunities and/or customer requests. So, request a FreightWaves SONAR demo or simply click the button below to get started.
There are many ways for shippers to take advantage of technology and advancements within the industry, but three key methods are essential for utilizing trucking data to source capacity. And knowing those three functions can make all the difference in the world to secure load capacity options for shippers. . Download the WhitePaper.
Today, logistics strategies rely on accurate and up-to-date data for everything from capacity planning to invoicing. Capturing, analyzing and applying data will help improve load capacity, boost delivery success rates, increase profit margins and enhance shipping insights. Download the WhitePaper. Request a SONAR Demo.
That’s regardless of whether it’s an asset-based broker or just someone who works with a company to source capacity. Download the WhitePaper. Request a SONAR demo online to get started. . Request a SONAR Demo. Nevertheless, it all adds up to a greater demand for integrated systems and real-time data.
Knowing the lead time helps warehouse managers understand when to restock inventory, allocate drivers, source more capacity, and take other necessary steps. It’s also an effective way to measure freight shipper reaction to trucking capacity. Download the WhitePaper. Request a SONAR demo today.
And part of that includes recognizing when existing contracts fall short and when to re-enter mini-bids, significantly as capacity tightens, says the Loadstar. Download the WhitePaper. This can greatly assist with capacity issues in the over-the-road trucking market. Request a SONAR Demo. Request a SONAR SCI Demo.
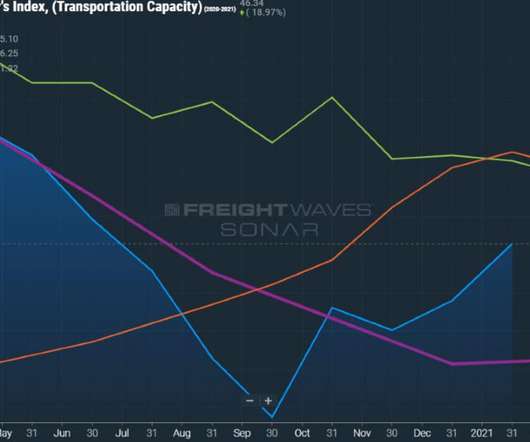
That’s even more true since transportation capacity, indicated by LMI.TPCP, is at 46.34, well below prior years’ averages in the above image. The problem: Shipping demand management includes a need to source capacity around the clock Capacity rules when it comes to keeping the supply chain moving and the trucks full.
We organize all of the trending information in your field so you don't have to. Join 84,000+ users and stay up to date on the latest articles your peers are reading.
You know about us, now we want to get to know you!
Let's personalize your content
Let's get even more personalized
We recognize your account from another site in our network, please click 'Send Email' below to continue with verifying your account and setting a password.


Let's personalize your content