This site uses cookies to improve your experience. To help us insure we adhere to various privacy regulations, please select your country/region of residence. If you do not select a country, we will assume you are from the United States. Select your Cookie Settings or view our Privacy Policy and Terms of Use.
Cookie Settings
Cookies and similar technologies are used on this website for proper function of the website, for tracking performance analytics and for marketing purposes. We and some of our third-party providers may use cookie data for various purposes. Please review the cookie settings below and choose your preference.
Used for the proper function of the website
Used for monitoring website traffic and interactions
Cookie Settings
Cookies and similar technologies are used on this website for proper function of the website, for tracking performance analytics and for marketing purposes. We and some of our third-party providers may use cookie data for various purposes. Please review the cookie settings below and choose your preference.
Strictly Necessary: Used for the proper function of the website
Performance/Analytics: Used for monitoring website traffic and interactions
Data represents an integral part of daily life for most people, and it is no different within the transportation industry. That insight into how freight logistics and optimization rely on data and understanding the full picture is critical to making the best improvements in supply chain route optimization too.
Quality and Detail of Data and its Analysis In some of our earlier posts, weve stressed the importance of simplicity in distribution network design , and we will return to that topic later in this article. It would be folly not to take advantage of data availability and accessibility.
According to Derrick Steiner of Digitalist Magazine , “Today’s leading companies are working very hard to be intelligent enterprises, capable of harnessing the power of end-to-end experience and operational data, to connecting their demand chain with their customers, who are social, mobile and shop in many channels, to their supply chain.
Of course, the big challenge in this type of external benchmarking is obtaining the necessary data, since many companies are wary of sharing performance data with potential competitors. Instead, its merely a common-sense guide to those supply chain KPIs that can best provide actionable data for general management purposes.
Real-time visibility and data into all things freight shipping is a supply chain gold standard. And nearly one-half of the industry’s freight market participants can see their data in real-time. Unfortunately, that doesn’t always amount to capturing real-time data outside of an individual company’s four walls. Now consider this.
In addition, returns typically cost more to handle than outbound shipments – 3 to 4 times more for traditional retail companies, for example. Hidden Opportunities for Supply Chain Cost Reductions Of course hidden costs, if you can find them, mean hidden opportunities. Some industries experience more returns than others.
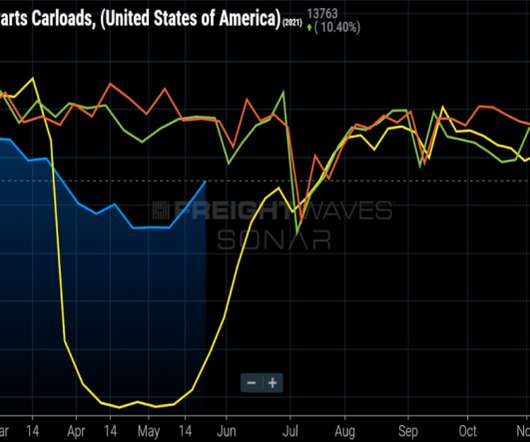
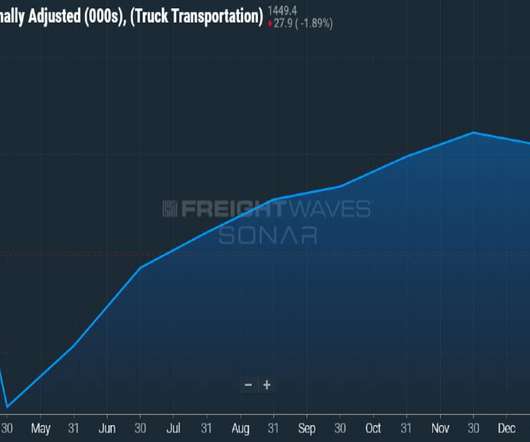
SONAR data show that the freight market for inbound Detroit loads is highly volatile based on auto production trends – inbound Detroit loads should be less expensive when OEMs are sourcing a lot of components as assembly volumes ramp up. There is typically more demand for inbound truckloads into Detroit than outbound truckloads.
The data indicates that export volumes are going down month on month and import volumes are increasing, making it detrimental to the US economy and concerns have been raised by several quarters in the media. As per data from Shifl.com, the import rates did come down slightly at the end of October but seems to be rising slightly again. “
Of course, moving forward also sets the tone for discussions about how Manhattan Associates customers are moving their businesses forward and how Manhattan is moving forward with its product roadmap. Additionally, users can pull trailers from the yard just-in-time to utilize the trailer inventory for outbound shipments.
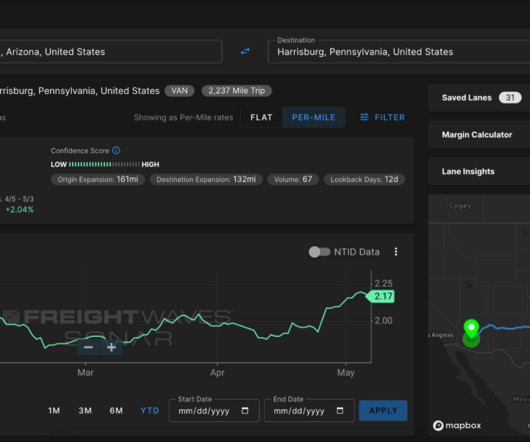
SONAR tender data and TRAC (Trusted Rate Assessment Consortium) spot rates can really set you apart from the competition when talking to your customers. All of these indices contain data as far back as 2018, enabling you to see daily changes as well as historical yearly patterns and trends. The post Where Is the Freight?
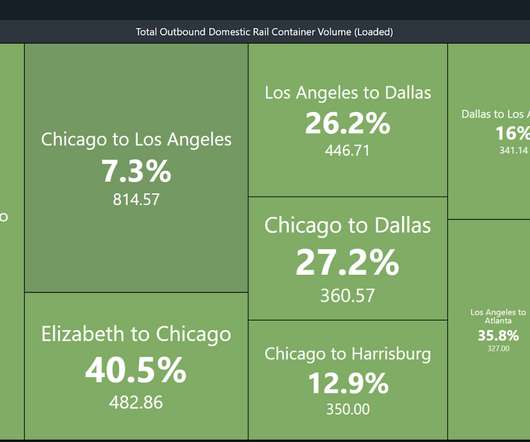
However, looking beyond the short-term and consider freight lane -specific data can go a long way to optimizing asset allocation and avoiding these risks. Headhaul indices provide insight into the balance of inbound and outbound freight Asset allocation remains a top-of-mind subject for carriers and asset-based freight brokers alike.
However, looking beyond the short-term and consider freight lane -specific data can go a long way to optimizing asset allocation and avoiding these risks. Headhaul indices provide insight into the balance of inbound and outbound freight Asset allocation remains a top-of-mind subject for carriers and asset-based freight brokers alike.
Implementing the solution involved cleaning up master data and mapping their complete global supply chain. Risk management solutions scrape data from hundreds of thousands of online & social-media sites, but Autoliv also has access to sources of information that they pay for. The implementation was not trivial.
Of course, that is all subjective and again dependent on market stability within individual locations in origin/destination pairings. The action: prioritize carriers within the routing guide based on which are preferred for shipments, depending on origin/destination data. Request a SONAR Demo. Request a SONAR SCI Demo.
This includes both outbound and inbound freight. Stale, Incomplete Data Is a Problem in Problem Solving. Usually it’s the data. Many times, the shipper goes to their IT department to get the data they need to run an analysis to find out how compliant they are or to look for strategies to lower their spend.
Using SONAR data in contract negotiations with carriers and 3PLs. . Of course, during that same period, many retailers performed extremely well. In addition, SONAR data could be used by retailers for strategic and longer-term decision-making, such as deciding where to locate warehouses and fulfillment centers. .
Control Both Inbound and Outbound Freight Effectively. Warehouses must effectively manage inbound and outbound freight concurrently. Visibility in your warehouse requires dedicated asset tracking, data collection, analysis and application, and continuous improvement across all employees and operations. What’s Next?
You can benefit from automated packing and shipping processes, such as the use of a transportation management system , for a more efficient outcome and flow around the warehouse on the outbound side of getting out product to your customer. The Importance of Real Time Data and Visibility in Technology Mirrors GEMBA and KANBAN Philosophies .
Of course, it would be possible to write an entire book on this particular subject, so for the sake of keeping this article relatively brief, I’ll stick to a short explanation of crucial factors to consider when planning a warehouse network (even if it is a network of one). Outbound Logistics: Keeping Customers Satisfied.
There are plenty of different shipping companies out there, and using a transportation management system to manage all inbound and outbound shipping needs will put those shippers who use one at an extreme competitive advantage. Have Easy to Analyze Actionable Insight Gleaned from the Data Created in the Transportation Management System.
Only those people who have duly completed the advanced traffic management course or its equivalent should write it. Describe the Outbound Transportation This description covers the movement of an outbound load from the company premises/warehouse to the customer’s destination. Download White Paper.
Quality and Detail of Data and its Analysis In some of our earlier posts, we’ve stressed the importance of simplicity in distribution network design , and we will return to that topic later in this article. It would be folly not to take advantage of data availability and accessibility.
Another methodology is the Porter’s Value Chain Framework, which comprises of inbound logistics, operations, outbound logistics, sales, and service. Outbound KPIs. Manufacturers need to set a base level using internal data and then measure the percentage change up or down against time.
Like traditional outbound logistics, return logistics requires the careful planning of pick-ups and deliveries of products, however, the involvement of end-consumers in the process creates additional complexities. Besides, failure of managing return logistics of such things may lead to an increased risk of exposing personal or company data.
So, it’s equally valuable to know the constraints and to apply data to overcome them with mini-bids. And lane-by-lane insights are critical to account for that disruption among raw material suppliers and the flow of outbound freight. It is what sets manufacturing supply chain companies apart. Download the White Paper.
is a distributor of pharmaceuticals, a global manufacturer and distributor of medical and laboratory products, and a provider of performance and data solutions for healthcare facilities. Across their inbound and outbound supply chains the goods are transported by air, ocean, rail, truckload, less-than-truckload, parcel, and even couriers.
Do they have strong software and IT capabilities for managing mass supply chain data? The risk that comes with that, of course, is what can happen to your “baby” if you completely entrust its growth and care to someone else. More “old school” 3PLs may rely on manual data pushes from their accounts.
Of course, it is helpful to have some statistics on hand to validate the statement above. Along with the design of supply chain strategy, the design of the supply chain itself, especially the part dealing with outbound distribution from plants or warehouses, is instrumental in the success or failure of businesses. .
What’s also clear from analyzing shipment data is that many of the largest consumer goods shippers have already converted the most obvious applicable shipments to intermodal. Those factors, of course, serve as limitations to converting truckloads into intermodal units. . That data excludes refrigerated and specialized loads.
In the second post we covered the first 3 areas: Data Capture, Knowledge of Carrier's Business, and Organization. Furthermore, when a shipper manages the inbound shipments, as well as the outbound, it can improve the relationship between client and shipper. In the last post of the series we will cover the final areas.
The volume of data generated by the Internet of Things (IoT) and an increasingly data-driven society is difficult to imagine, explains Manufacturing Business Technology magazine. Now, consider that volume of data, analyzing it and leveraging it across millions of SKUs and operations in manufacturing.
The emergence of cloud-based platforms and Big Data increases forecast accuracy, eliminates unnecessary stock, and achieves truly optimized slotting designs. Big Data can analyze picking performance and identify best practices to increase performance, effectively reducing the amount of on-hand inventory needed at any given time.
Once you have gathered the data relating to your customers’ needs, you should be able to see if a single logistics strategy will work for your entire customer base, or whether you need to take a segmented approach. Then, you can analyse your current supply chain capabilities using the research results and your data concerning customer needs.
Too much leads to resources being monopolised on gathering tons of data and a subsequent risk of “paralysis by analysis” Cost to Serve (CTS) is an approach that helps you avoid both extremes. Outbound transportation. It can of course also be used to make an already profitable relationship even more profitable!
Add to that, the advantage of data available through a sophisticated 3PL platform is as relevant to ecommerce business growth as a good pair of running shoes is to a track star. A 3PL platform that provides access to all these in one place with a user-friendly interface allows businesses to save time and headspace. And so on and so on.
KN regards the joint venture an important step in its digitalisation strategy, with key areas of interest being big data and predictive analytics, artificial intelligence, blockchain and robotics. The JV’s name will be announced in due course, a KN spokesperson told Automotive Logistics.
Inventory correction Early in the course of this shift to the East, industry experts pointed to inventory offloading as a potential contributing factor. “The trend is more important than the current value in this situation,” Strickland continued. It takes time for carriers to adjust to new freight patterns.
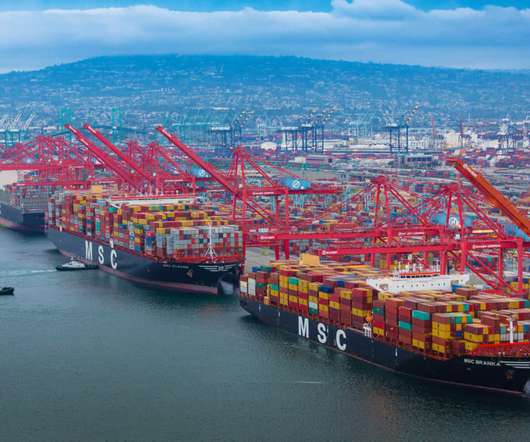
Department of Transportation’s Bureau of Transportation Statistics to collect data on berthing and cargo practices at U.S. But if we look a closer look at the volumes, the increase in outbound empty volumes corresponds to the increase in import full volumes as carriers are forced to move out more and more of the empties.
You see, the set of primary data needed to keep an airliner aloft is (apparently) relatively simple—and the same is true of running a supply chain organisation. These key metrics become your organisation’s “multi-function display” and give you the primary data needed to monitor and manage “normal flight conditions.”
Notwithstanding the requirements of your customers, which must of course drive the way you manage operational processes, excessive cycle times almost always increase working capital and often curtail opportunities for profit gains. When data transfer is slow, so is the movement of materials. Reasons to Target Cycle Times.
For most companies, margins only declined further in 2021, as product shortages and transportation roadblocks forced all supply chain participants to make critical decisions on the fly, acting without complete information or hard data. Often these solutions execute a seamless, autonomous response based on pre-defined objectives.
This of course includes Europe and the UK, where the number of companies understanding the productive power and cost efficiency of these platforms is ramping up. The AMRs produce standardised data, free from human error to feed AI and big data technology. Hikrobot’s first UK application is at Superdry.
Inventory correction Early in the course of this shift to the East, industry experts pointed to inventory offloading as a potential contributing factor. “The trend is more important than the current value in this situation,” Strickland continued. It takes time for carriers to adjust to new freight patterns.
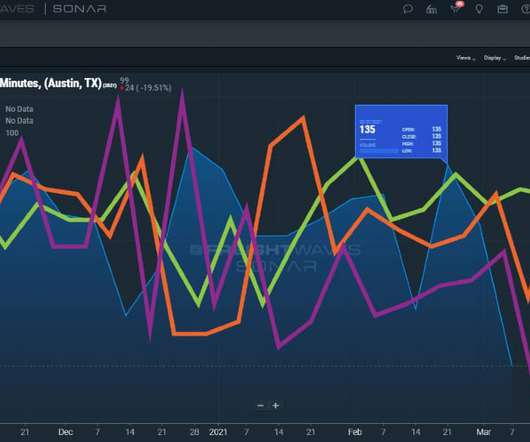
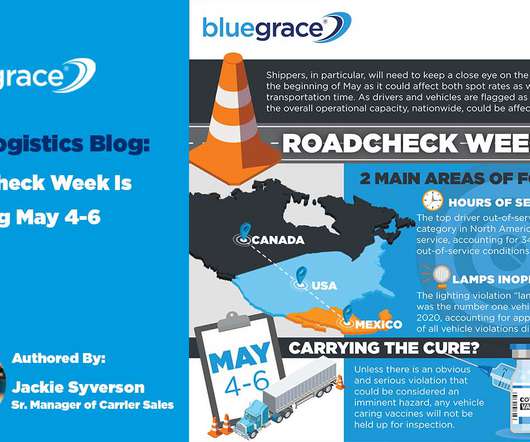
Other than data collection, the inspection process is the same. During Roadcheck week, the Outbound Tender Volume Index (OTVI) drops precipitously, causing a shortage in both transportation volume as well as fluctuations in available capacity. Shippers will need to take Roadcheck week into account when planning their freight movement.
We organize all of the trending information in your field so you don't have to. Join 84,000+ users and stay up to date on the latest articles your peers are reading.
You know about us, now we want to get to know you!
Let's personalize your content
Let's get even more personalized
We recognize your account from another site in our network, please click 'Send Email' below to continue with verifying your account and setting a password.


Let's personalize your content