This site uses cookies to improve your experience. To help us insure we adhere to various privacy regulations, please select your country/region of residence. If you do not select a country, we will assume you are from the United States. Select your Cookie Settings or view our Privacy Policy and Terms of Use.
Cookie Settings
Cookies and similar technologies are used on this website for proper function of the website, for tracking performance analytics and for marketing purposes. We and some of our third-party providers may use cookie data for various purposes. Please review the cookie settings below and choose your preference.
Used for the proper function of the website
Used for monitoring website traffic and interactions
Cookie Settings
Cookies and similar technologies are used on this website for proper function of the website, for tracking performance analytics and for marketing purposes. We and some of our third-party providers may use cookie data for various purposes. Please review the cookie settings below and choose your preference.
Strictly Necessary: Used for the proper function of the website
Performance/Analytics: Used for monitoring website traffic and interactions
Enterprise shippers have always been an integral part of the maritime shipping industry and its partnership with truck fleet management. And likewise, maritime transportation has been a dominant player in global transportation for decades. Take a look at 8 shipping challenges in the maritime, or ocean, mode.
H aving access to real-time freight data and being able to make good use of it is essential for global trade and maritime shipping. Global retailers use data to understand lead time Successful supply chain operation at any stage hangs on the ability to stay on top of shipping and transport logistics. Request a SONAR Demo.
Well, the maritime market is in the middle of its own “August madness.” The maritime market madness has caused some retailers to wonder if Christmas is going to be canceled. The pressure in the maritime market has been caused by numerous factors including: Historically high U.S. Request a SONAR Demo.
All three major modes of transportation – maritime, intermodal and truckload – all have very different peak season timelines. The maritime sector has been operating at peak season-like levels for much of the past year. Traditional maritime peak season has passed, with goods needed for the holiday season already stateside.
This “SONAR highlight reel,” which we publish every other week, is intended to concisely hit data highlights and trends in truckload, intermodal and maritime. Truckload demand has stabilized at a high level after declining seasonally to start the fourth quarter. Request a SONAR Demo. Request a SONAR SCI Demo.
This “SONAR highlight reel,” which we plan to publish every other week, is intended to concisely hit data highlights and trends in truckload, intermodal and maritime. Maritimedata suggests that further shipment delays, elevated ocean rates and a strained domestic transportation network should be expected.
According to Maritime Executive , “Eight international carriers split into three different alliances control 80% of the market today. And that’s why it’s important for carriers to apply data and enable predictive freight rating through these five requirements. Now, the industry is changing yet again. Download the White Paper.
This “SONAR highlight reel,” which we publish every other week, is intended to concisely hit data highlights and trends in truckload, intermodal and maritime. Spot rates continue to rise as freight flows to the spot market – particularly on the West Coast. Request a SONAR Demo. Request a SONAR SCI Demo.
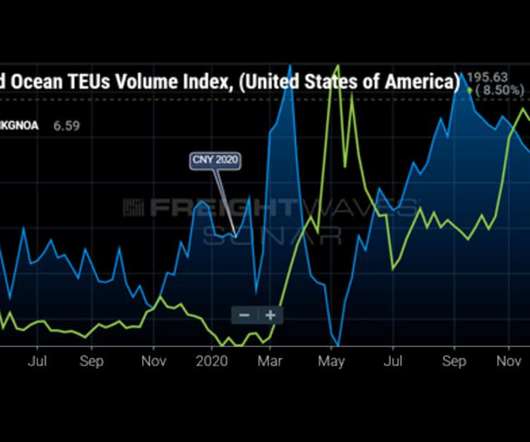
In fact, our data shows that accepted tender volume is up 12% y/y. SONAR intermodal contract rate data shows rates up 19% from this time last year. Maritime import volume remains robust and it appears that the ports of LA and Long Beach will announce a record December when the data is released. Request a SONAR Demo.
This “SONAR highlight reel,” which we plan to publish every other week, is intended to concisely hit data highlights and trends in truckload, intermodal and maritime. The end of the second quarter is typically a strong period for truckload freight and this year is no exception. Request a SONAR Demo. Request a SONAR SCI Demo.
See description of the just-released FreightWaves Trusted Rate Assessment Consortium (TRAC) spot rate data on pages 5-6. Request a SONAR Demo. Request a SONAR SCI Demo. View the Full White Paper. Truckload demand has started to pick up ahead of the Thanksgiving holiday. Long Beach port complex down 13% from peak levels in May.
3-6), maritime (p. The maritime industry has been in peak season mode since the middle of last year and import volumes have been consistently higher year-over-year. Goods for the holiday shopping season are largely already stateside, which has led to a decline in our forward-looking ocean bookings data. Request a SONAR Demo.
Identifying trends in the maritime market is also important, because increased ocean freight impacts domestic transportation markets as freight arrives on shore. The current trends in maritime shipping data suggest increased shipment delays and further inflationary pressures on rates. Request a SONAR Demo.
More Resources Home December 6, 2023 Update The Freightos Weekly Update helps you stay on top of the latest developments in international freight by giving you the rundown on the latest economic data, ocean and air demand trends, rate data – and anything else impacting the market. Freightos Air Index data show that China – N.
More Resources Home March 27, 2024 Update The Freightos Weekly Update helps you stay on top of the latest developments in international freight by giving you the rundown on the latest economic data, ocean and air demand trends, rate data – and anything else impacting the market. According to Vespucci Maritime, the port handled 1.1
This “SONAR highlight reel,” which we publish every other week, is intended to concisely hit data highlights and trends in truckload, intermodal and maritime. Request a SONAR Demo. Request a SONAR SCI Demo. Holiday noise is dramatically impacting the major truckload indicators.
More Resources Home February 28, 2024 Update The Freightos Weekly Update helps you stay on top of the latest developments in international freight by giving you the rundown on the latest economic data, ocean and air demand trends, rate data – and anything else impacting the market. America weekly prices increased 32% to $4.8/kg
This “SONAR highlight reel” freight market update report, which we plan to publish every other week, is intended to concisely hit data highlights in the truckload, intermodal and maritime industries. June is typically a strong period for truckload demand and this June is proving to be no exception. Request a SONAR Demo.
This “SONAR highlight reel,” which we publish every other week, is intended to concisely hit data highlights and trends in truckload, intermodal and maritime. Request a SONAR Demo. Request a SONAR SCI Demo. Meanwhile, tender rejection rates have climbed 200 basis points since the beginning of August.
This “SONAR highlight reel,” which we publish every other week, is intended to concisely hit data highlights and trends in truckload, intermodal and maritime. Request a SONAR Demo. Request a SONAR SCI Demo. Spot rates have rebounded in the majority of the country after a post-Labor Day hiccup, according to Truckstop.com.
This “SONAR highlight reel,” which we plan to publish every other week, is intended to concisely hit data highlights and trends in truckload, intermodal and maritime. Request a SONAR Demo. Request a SONAR SCI Demo. West Coast to more accurately reflect ocean rates in the currently tight market. .
are reliant on the maritime shipping industry moving freight from overseas to this country. Like many other sectors of the global logistics/supply chain/freight world, the maritime industry is investing in technology in order to modernize and automate processes to create more visibility. Request a SONAR Demo.
This “SONAR highlight reel,” which we publish every other week, is intended to concisely hit data highlights and trends in truckload, intermodal and maritime. See description of the just-released FreightWaves Trusted Rate Assessment Consortium (TRAC) spot rate data on pages 5-6. Request a SONAR Demo.
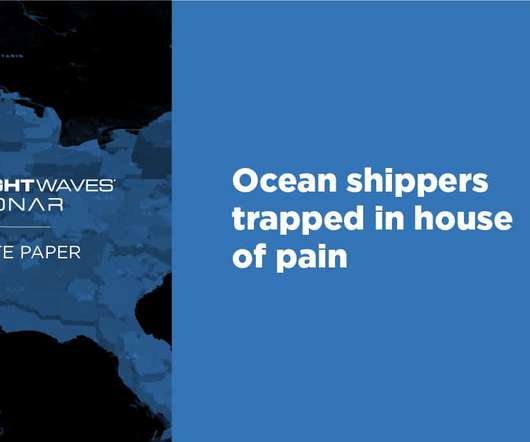
Supply chains have fractured under the weight of recent maritime import demand, forcing shippers like Peloton (NASDAQ: PTON) to find pricier alternatives in order to not miss their window of opportunity. And it all begins with getting the right data sources and insights at your fingertips to navigate the freight market.
This “SONAR highlight reel,” which we plan to publish every other week, is intended to concisely hit data highlights and trends in truckload, intermodal and maritime. Request a SONAR Demo. Request a SONAR SCI Demo. This past week was one where we heard numerous complaints from intermodal shippers regarding service.
The song was built using a demo track from John Lennon dating back to the 1970s and a guitar track from George Harrison from 1995. The song was supposed to come out back in 1995 as part of The Beatles Anthology, along with Free as a Bird and Real Love , two other tracks culled from 1970s Lennon demos. To keep commerce flowing, the U.S.
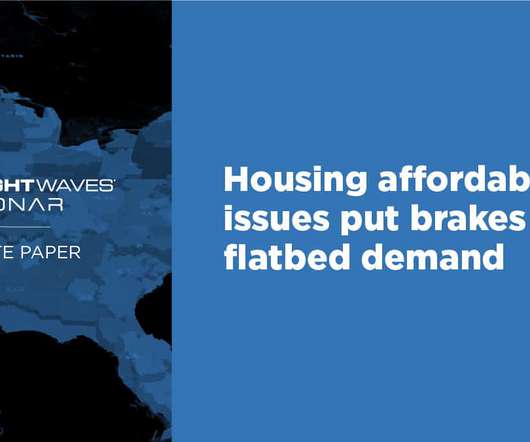
But, market forces have put the brakes on the continuous improvement in the market (from the perspective of the carriers) and the latest housing-related data points are off their recent highs, as are most flatbed-related data points. Request a SONAR Demo. Request a SONAR SCI Demo.
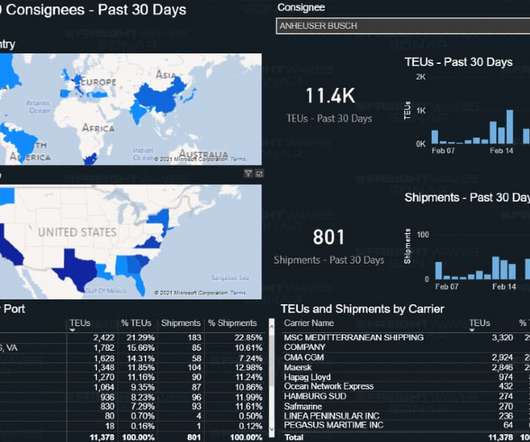
Based on information in the Ocean Shipments Report, maritime freight will continue to arrive at U.S. And now this proprietary data that is unique to SONAR is displayed like never before, thanks to a new dashboard. SONAR is the only data platform in the world that has this data set. when and in what volume.
Customs Maritime Import Shipments on a monthly basis. This data can show you how importers are choosing to route their shipments. SONAR US Customs Maritime Import Shipments (CSTM). The US Customs Maritime Import Shipment Index is a 7 day moving average of shipments into a given port based on US Customs data.
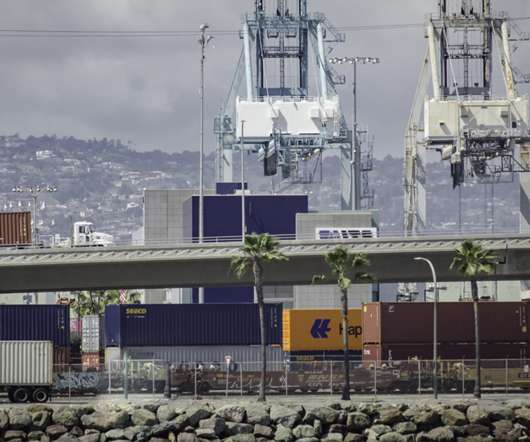
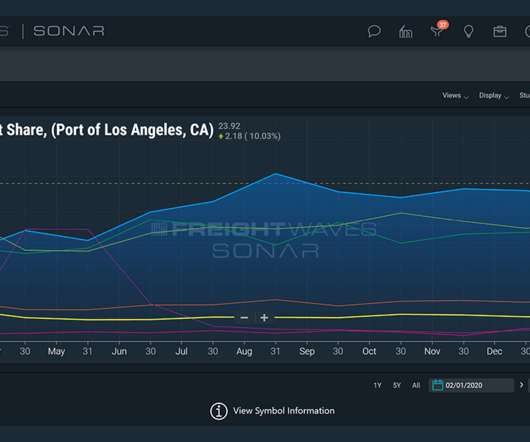
The ports of Los Angeles and Long Beach account for over 40% of the total maritime import shipment volumes. Image – SONAR Tree Map of import market share The largest lanes for maritime imports originate in China and end on the North American West Coast, predominantly the ports of Los Angeles and Long Beach. Request a SONAR Demo.
The data suggest that ocean congestion and service issues are not likely to be alleviated near-term. Request a SONAR Demo. Request a SONAR SCI Demo. West Coast routes and rising volumes of booked vessels from China to SoCal; and (7) severe congestion at U.S. ports, particularly the Ports of Los Angeles and Long Beach.
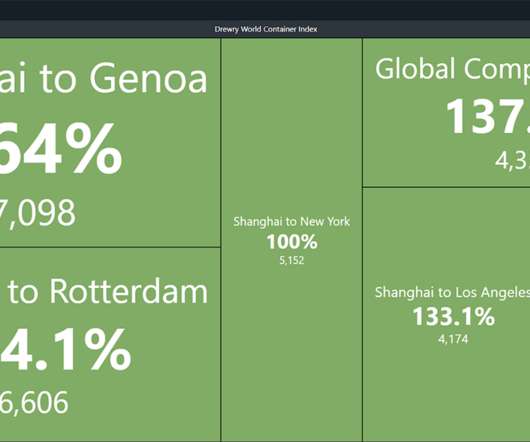
This week, learn how freight market participants are monitoring spot ocean freight rates of 40-foot containers in seven major maritime shipping lanes using the Drewry World Container Index (WCI). The Drewry World Container Index (WCI) measures the bi-weekly ocean freight rate movements of 40-foot containers in seven major maritime lanes.
From now on, users can use sea routes in their mapping, enabling them to visualize their maritime transport and set up routing restrictions to ensure routes avoid specific areas. Additionally, the geographical data precision is enhanced with the inclusion of Nomenclature of Territorial Units for Statistics (NUTS).
Data sets across modes show evidence of risk mitigation At this point, it’s unclear whether there will be a strike, as the International Longshoremen’s Association (ILA) is threatening, or whether a strike will be avoided, perhaps by the president invoking the Taft-Hartley Act ahead of the strike deadline. as a whole.
Data sets across modes show evidence of risk mitigation At this point, it’s unclear whether there will be a strike, as the International Longshoremen’s Association (ILA) is threatening, or whether a strike will be avoided, perhaps by the president invoking the Taft-Hartley Act ahead of the strike deadline. as a whole.
We’ve been busy fine-tuning our platform, nailing our pitch, bringing on new customers, demoing for clients, and speaking at and attending different freight and logistics conferences. Inclusive Deployment of Blockchain for Supply Chains: Part 4 – Protecting Your Data. Trans-Pacific Maritime Conference: TPM in Long Beach, CA.
With the threat and frequency of attacks increasing and many container carriers now diverting away from the Suez Canal as a result, the international maritime community is mobilizing to restore security, though in the meantime disruptions are increasing too. Live map of Suez Canal and Red Sea, Dec. Get Your Custom Report Now!
Home March 20, 2025 Update The Freightos Weekly Update keeps you informed on international freight with key economic data, demand trends, and rate insights. The Federal Maritime Commission also recently opened an investigation into foreign government roles in container chokepoints.
We organize all of the trending information in your field so you don't have to. Join 84,000+ users and stay up to date on the latest articles your peers are reading.
You know about us, now we want to get to know you!
Let's personalize your content
Let's get even more personalized
We recognize your account from another site in our network, please click 'Send Email' below to continue with verifying your account and setting a password.


Let's personalize your content