This site uses cookies to improve your experience. To help us insure we adhere to various privacy regulations, please select your country/region of residence. If you do not select a country, we will assume you are from the United States. Select your Cookie Settings or view our Privacy Policy and Terms of Use.
Cookie Settings
Cookies and similar technologies are used on this website for proper function of the website, for tracking performance analytics and for marketing purposes. We and some of our third-party providers may use cookie data for various purposes. Please review the cookie settings below and choose your preference.
Used for the proper function of the website
Used for monitoring website traffic and interactions
Cookie Settings
Cookies and similar technologies are used on this website for proper function of the website, for tracking performance analytics and for marketing purposes. We and some of our third-party providers may use cookie data for various purposes. Please review the cookie settings below and choose your preference.
Strictly Necessary: Used for the proper function of the website
Performance/Analytics: Used for monitoring website traffic and interactions
The platform’s data-driven insights and yard management capabilities further optimize operations and support informed decision-making. Data-driven insights: Velostics platform provides valuable data analytics to optimize facility performance and improve operational efficiency.
Maintaining good compliance to these informational guides is critical to supply chain management and relies heavily on current data and automation. Missing data amounts to inevitable routing guide failures Data is king in today’s ever-changing market, and it is only becoming more vital for supply chain operations and management.
Data access and analysis continue to be essential to competitive operations within the process of monitoring rates and expenses in intermodal shipping lanes. Data access to see savings compared to truckload and other shipping methods. Data accuracy can and does impact freight transportation in a significant way.
Data represents an integral part of daily life for most people, and it is no different within the transportation industry. That insight into how freight logistics and optimization rely on data and understanding the full picture is critical to making the best improvements in supply chain route optimization too.
Reaching mutually beneficial service level agreements (SLA) or trade agreements depends on the access and utilization of current logistics data and a decent amount of preparation. Far too often, there is a severe lack of real-time logistics data to work with during this process. Download the White Paper.
The abundant data sources can make the process of assessing the market more difficult than necessary. Shippers and carriers should make more definitive decisions in selecting their data sources. Because data sources matter to assess accurately and objectively the over the road trucking market. . Outbound tender rejections.
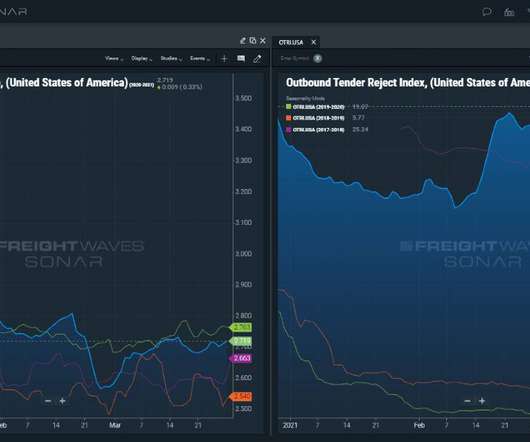
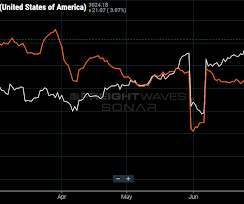
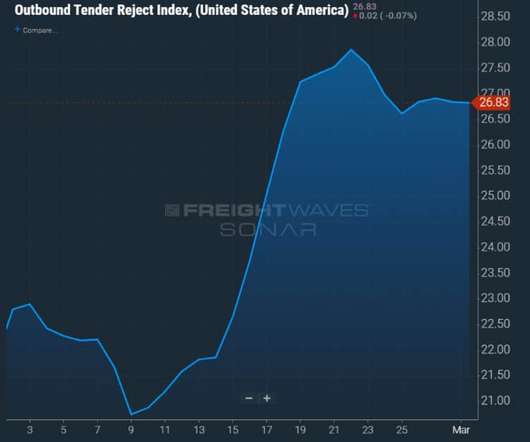
Within SONAR, the Outbound Tender Reject Index (blue) In early October eclipsed 5% for the first time since the Fourth of July holiday. At the same time, the Outbound Tender Volume Index (white) has yet to move meaningfully higher, despite record import levels. The post Prepping For The Retail Rush appeared first on SONAR.
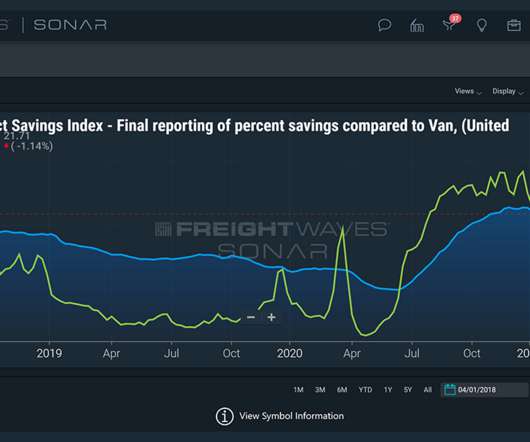
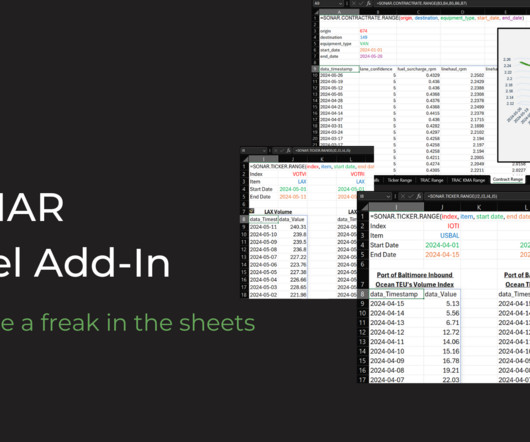
This “SONAR highlight reel,” which we plan to publish every other week, is intended to concisely hit data highlights and trends in truckload, intermodal and maritime. That has put intermodal further out of reach for spot shippers in the lanes outbound from L.A. Request a SONAR Demo. Request a SONAR SCI Demo.
This week, learn how freight market participants, especially those freight parties who are executing refrigerated shipping moves, rely on SONAR indices that show reefer freight data and activity. What are the available refrigerated shipping indices in SONAR? The index is expressed as a percentage of loads rejected to total loads tendered.
This “SONAR highlight reel,” which we publish every other week, is intended to concisely hit data highlights and trends in truckload, intermodal and maritime. Spot rates continue to rise as freight flows to the spot market – particularly on the West Coast. These declines are concentrated in the outbound L.A. Request a SONAR Demo.
The current trends in maritime shipping data suggest increased shipment delays and further inflationary pressures on rates. The SONAR data platform offers the fastest and deepest set of freight market data on the planet. Request a SONAR Demo. Request a SONAR SCI Demo.
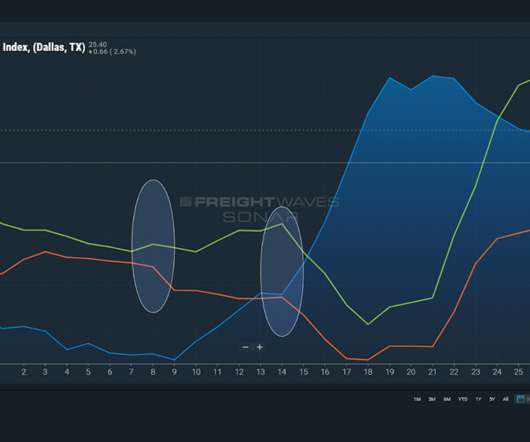
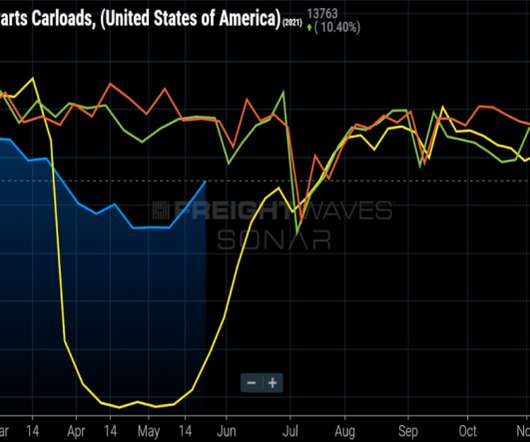
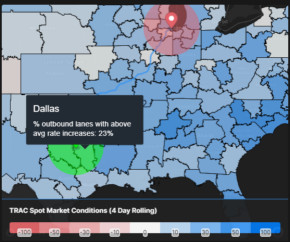
In the image below, use the following as your guide to interpreting: Blue = outbound tender rejections for the Dallas market, which measure service, capacity and price. Green = outbound volumes (demand). It shows outbound volumes increasing and inbound supply decreasing. Capacity signals for the freight market.
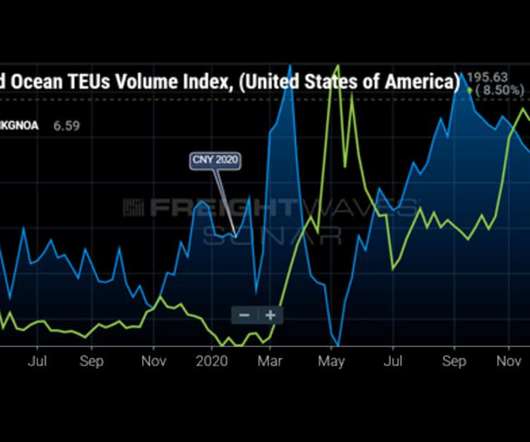
The Outbound Ocean TEU Index (OOTI) from Vietnam to the U.S. Outbound Air Cargo Tons out of Ho Chi Minh City are expected to grow leading into the holiday season as shippers rely heavily on air cargo. The SONAR data platform offers the fastest and deepest set of freight market data on the planet. Request a SONAR Demo.
According to Derrick Steiner of Digitalist Magazine , “Today’s leading companies are working very hard to be intelligent enterprises, capable of harnessing the power of end-to-end experience and operational data, to connecting their demand chain with their customers, who are social, mobile and shop in many channels, to their supply chain.
The modern supply chain rests on a mountain of shipping data. However, the applications of real-time freight data remain disparate and lack value. Since on-time delivery accounts for both inbound and outbound freight , it has a natural effect on the full supply chain. Request a SONAR demo today. Request a SONAR Demo.
Advancements in tender data science and paid market data now power SONAR SCI (Supply Chain Intelligence) Lane Acuity Plus. In the screenshot above, you can see that the outbound and inbound stability show scores of 29 out of 100 and 21 out of 100, respectively. WHAT IS LANE ACUITY PLUS?
The WRI combines outbound tender market share (OTMS) and the weekly change in tender rejection rates (OTRIW). For example Atlanta’s OTMS value is 4% and outbound rejections increased from 3% to 5% over the past seven days. FreightWaves SONAR is the fastest and most comprehensive freight market data and analytics platform in the world.
When freight market participants are able to get a leading indicator instead of historical data, they are able to proactively plan for assets needed, capacity, and the potential price of freight for drayage and surface transportation moves that head to inland markets after ocean shipments go from the port to roads. ports to China).
Real-time visibility and data into all things freight shipping is a supply chain gold standard. And nearly one-half of the industry’s freight market participants can see their data in real-time. Unfortunately, that doesn’t always amount to capturing real-time data outside of an individual company’s four walls. Now consider this.
More freight brokers are turning to technology and transportation data to grow their businesses by understanding the true freight market rate. . It’s not solely about knowing basic rates – it’s about using freight data to make the best decisions for all loads – playing both the buy-side and sell-side aspects of freight brokering.
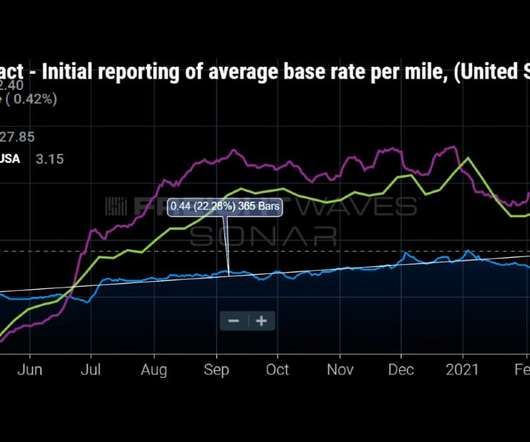
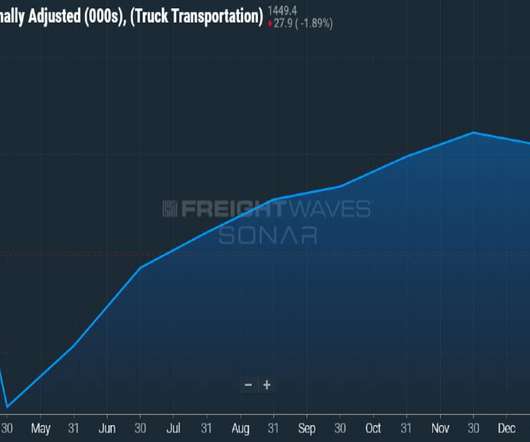
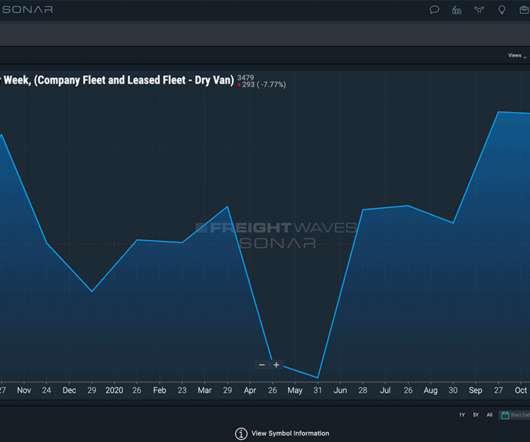
Chart of the Week : Van Contract Base Rate per Mile Initial, Van Outbound Tender Reject Index , Truckstop Average Van Spot Rate per Mile – USA SONAR: VCRPM1.USA, Some mean reversion is imminent, but the national Outbound Tender Reject Index shot back over 28% this week, near its peak value around Thanksgiving of this past year.
SONAR data show that the freight market for inbound Detroit loads is highly volatile based on auto production trends – inbound Detroit loads should be less expensive when OEMs are sourcing a lot of components as assembly volumes ramp up. There is typically more demand for inbound truckloads into Detroit than outbound truckloads.
With all the advances in technology and a continuous need to just do more with less, it’s imperative for shippers to start by assessing the quality of their basic data and analytics tools. The best way to stay strategic in today’s supply chain begins and ends with data. Request a SONAR Demo. Request a SONAR SCI Demo.
For example, the Outbound Tender Volume Index (OTVI) is a 7-day moving average of shippers’ requests for capacity. The SONAR data platform offers the fastest and deepest set of freight market data on the planet. Request a SONAR Demo. Request a SONAR SCI Demo.
The action: prioritize carriers within the routing guide based on which are preferred for shipments, depending on origin/destination data. What is a routing guide : a set of rules and requirements from shippers that set rules for inbound and outbound shipping. Request a SONAR SCI Lane Acuity demo by clicking the button below today. .
Should] you just figure out if it should be 5% or 6% [without data]?” Unlike other tools in the market, the Lane Signal considers an abundance of data from multiple sources, not just dirty data that flows through one system like other industry tools. SONAR is near-real-time data. Request a SONAR Demo.
However, looking beyond the short-term and consider freight lane -specific data can go a long way to optimizing asset allocation and avoiding these risks. Headhaul indices provide insight into the balance of inbound and outbound freight Asset allocation remains a top-of-mind subject for carriers and asset-based freight brokers alike.
However, looking beyond the short-term and consider freight lane -specific data can go a long way to optimizing asset allocation and avoiding these risks. Headhaul indices provide insight into the balance of inbound and outbound freight Asset allocation remains a top-of-mind subject for carriers and asset-based freight brokers alike.
Remember, it’s not all about outbound loads either. Usually, it’s a mix between inbound and outbound loads for shippers. What’s your mix between inbound and outbound loads? . FreightWaves SONAR provides the fastest freight market data in the world, across all major modes of traffic. Request a SONAR Demo.
The data analyzed within today’s freight market goes back to the beginning of digital transformation. Contract versus spot data factors influence the profitability of all fleet assets. Both contract and spot market data factors influence the profitability of all fleet assets. Request a SONAR Demo. trucking market.
SONAR tender data and TRAC (Trusted Rate Assessment Consortium) spot rates can really set you apart from the competition when talking to your customers. All of these indices contain data as far back as 2018, enabling you to see daily changes as well as historical yearly patterns and trends. The post Where Is the Freight?
Trucking has a decisive advantage on shorter, irregular runs moving in or out of less populated regions, which are also core reasons to view lane-by-lane market data too. . Request a SONAR Demo. Request a SONAR SCI Demo. Download the White Paper. And finally, using new IMCSI tickers within SONAR, it’s easier to make that call.
Companies are rapidly adopting and using real-time data to clearly understand challenges to better mitigate unexpected problems when they arise. In fact, logisticians should consider these top five use cases of increased visibility and data within logistics and how they improve throughput. Download the White Paper.
Once installed, everyone from boomers to Gen Alpha (if a 14-year-old has interest in logistics data) gains access to incorporate SONAR’s millions of data points into their day with nothing more than a user login and password. While you’re at it, throw in the SONAR Lane Score to see if you’re quoting an outbound-heavy lane.
So, it’s equally valuable to know the constraints and to apply data to overcome them with mini-bids. And lane-by-lane insights are critical to account for that disruption among raw material suppliers and the flow of outbound freight. Request a SONAR SCI Lane Acuity demo to get started or click the button below.
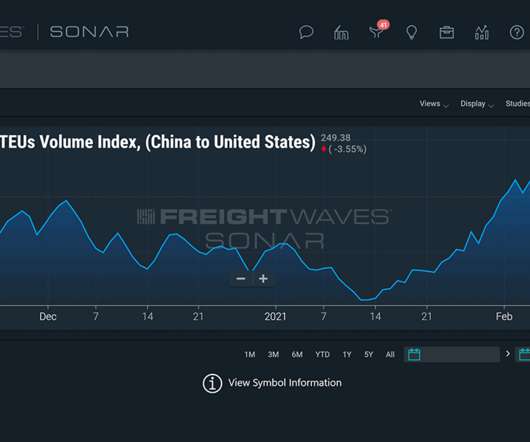
The Ocean TEU Index measures booking requests for capacity, much like the Outbound Tender Volume Index (OTVI) does for domestic trucking. And it all begins with getting the right data sources and insights at your fingertips to navigate the freight market. Request a FreightWaves SONAR demo by clicking the button below to get started.
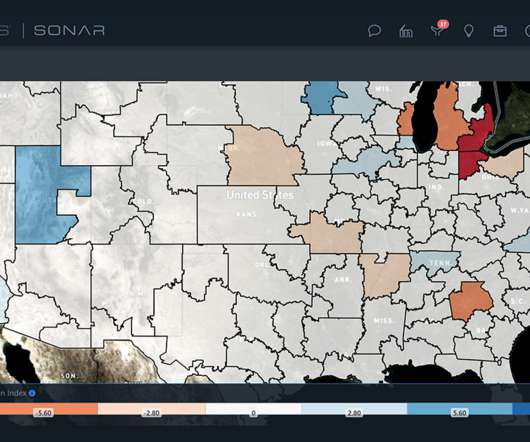
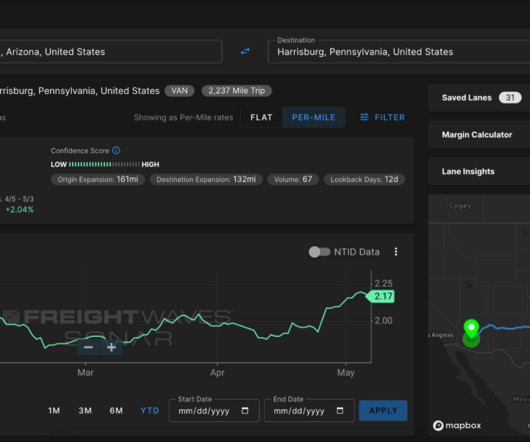
While being able to return a spot rate per mile on a lane is a valuable data point, the rate alone cannot paint a full picture of the market conditions that are influencing that rate up or down. For brokers, the Market Conditions map helps identify which outbound markets are showing overall increases in rates.
Let’s look at seven ways that freight technology and data achieves that goal. Freight data reduces dwell time and load time. New advances in data-driven transportation management help reduce dwell time impact by streamlining scheduling and avoiding bottlenecks in the yard. Data-driven processes streamline shipping.
And to help carriers achieve that goal, this white paper will explore a few best practices to reduce operating costs, including: The importance of meaningful data capture. Prioritizing moves based on inbound and outbounddata trends. Tracking and applying equipment data insights. Using data to streamline RFP processes.
However, peer, market and historical freight invoice data can help, and it’s essential to know why. Freight management parties still struggle with limited, outdated data. Freight management parties may not know where to turn for meaningful, actionable freight data. At the same time, data is not created equally.
Collaboration means parties must share data in real-time. That includes compliance with the inbound freight routing guide and outbound activities. They sort through prior quotes, invoices and shipment data to check invoice accuracy. Put the right shipping analytics tools to work with freight data resources.
Data sets across modes show evidence of risk mitigation At this point, it’s unclear whether there will be a strike, as the International Longshoremen’s Association (ILA) is threatening, or whether a strike will be avoided, perhaps by the president invoking the Taft-Hartley Act ahead of the strike deadline. year over year in Q3 of 2024.
Data sets across modes show evidence of risk mitigation At this point, it’s unclear whether there will be a strike, as the International Longshoremen’s Association (ILA) is threatening, or whether a strike will be avoided, perhaps by the president invoking the Taft-Hartley Act ahead of the strike deadline. year over year in Q3 of 2024.
A growth in import volumes could help balance the markets as outbound demand rises. While these are nearby, they will also require “deadheading,” in which they move the truck without an active paying load, driving up the outbound rate. Request a SONAR Demo. Savannah, however, is on the opposite end of that spectrum.
We organize all of the trending information in your field so you don't have to. Join 84,000+ users and stay up to date on the latest articles your peers are reading.
You know about us, now we want to get to know you!
Let's personalize your content
Let's get even more personalized
We recognize your account from another site in our network, please click 'Send Email' below to continue with verifying your account and setting a password.


Let's personalize your content