This site uses cookies to improve your experience. To help us insure we adhere to various privacy regulations, please select your country/region of residence. If you do not select a country, we will assume you are from the United States. Select your Cookie Settings or view our Privacy Policy and Terms of Use.
Cookie Settings
Cookies and similar technologies are used on this website for proper function of the website, for tracking performance analytics and for marketing purposes. We and some of our third-party providers may use cookie data for various purposes. Please review the cookie settings below and choose your preference.
Used for the proper function of the website
Used for monitoring website traffic and interactions
Cookie Settings
Cookies and similar technologies are used on this website for proper function of the website, for tracking performance analytics and for marketing purposes. We and some of our third-party providers may use cookie data for various purposes. Please review the cookie settings below and choose your preference.
Strictly Necessary: Used for the proper function of the website
Performance/Analytics: Used for monitoring website traffic and interactions
Each technician visit, customer interaction and service delivery generates valuable data points. What is a data warehouse? What is a data warehouse? A data warehouse is a comprehensive system that collects, organizes and delivers business information in a way that makes it immediately useful.
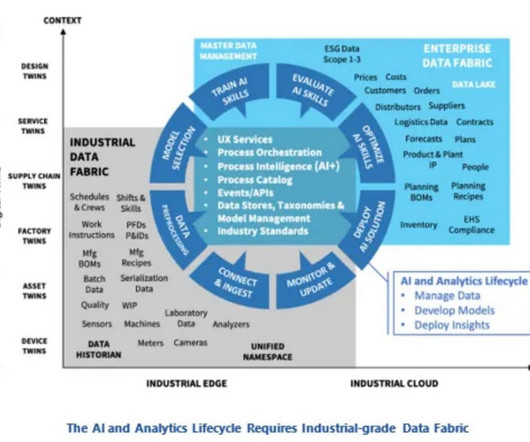
Many global multinationals accelerated their investments in digitizing data during the pandemic. According to Colin Masson, a director of research at ARC Advisory Group, the opportunity to mine these vast quantities of data to achieve business value is “NOW.” Mr. Masson leads ARC’s research on industrial AI and data fabrics.
These are big data platforms that monitor news sources and assorted databases from governments, financial institutions, ESG NGOs, and other sources to detect when an adverse event has occurred or may be about to occur. Most argue that when the UI is trained with the companys own data, the risk of hallucination is small.
A single, centralized source of truth for your organizations data is no longer a luxuryits a necessity for businesses seeking to scale efficiently, enhance profitability, and make informed, data-driven decisions. This leads to: Inconsistent reporting: Different branches track data differently, making comparisons difficult.
In this eBook, we’ll run through real-world examples that show how RevOps teams can benefit from modern solutions for the access, management, and activation of their GTM data.
Why Modern Data Warehouses Are No Longer Optional A centralized data warehouse is becoming an essential solution for businesses looking to scale efficiently and optimize operations. It’s no longer just a “nice to have,” but a critical repository for processing vast amounts of business data.
Killing Ghost Loads and Phantom Data with Michael Darden. Michael Darden and Joe Lynch discuss killing ghost loads and phantom data. Michael is the CEO of DFM Data Corp, a utility company designed to be a tool between digital partners moving freight in the USA and Canada. About DFM Data Corp. DFM Data Corp.
They sell to the automotive, data communications, medical, industrial, consumer electronics, and other industries. For example, the application sends three auto reminders to a buyer if a PO they cut does not have a corresponding purchase order confirmation associated with it. The company uses a process monitoring tool called Celonis.
For these companies, maintaining profitability while protecting their margins hinges on operational efficiency and the strategic use of data. Data is critical to managing every dimension of the business. Lets explore how AI and BI empower these industries, using specific examples to illustrate their transformative potential.
To combat the effects of the tightening labor market, agile logistics companies are focusing their efforts on adopting tools and processes that drive efficiency and help their operations’ teams tap into shared industry resources. Why streamlining data simplifies the logistics role.
As businesses strive to stand out, leveraging data effectively has become a game-changer. One of the most powerful yet underutilized tools for achieving this is decile data analytics. What Is Decile Data? For example , let’s consider a dataset of 100 lawn measurements in a given town.
Learn how to organize your data operations in alignment with supply chain strategy. Cloud-based supply chain management tools, the Internet of Things (IoT), artificial intelligence (AI) and machine learning are expected to figure prominently in future supply chain operations. More data is coming in than ever before.
One essential tool used by the supply chain team is supply chain design. Energy management solutions are products that energy utilities use to produce power and data centers use to consume power. One key tool they use to accomplish this is a supply chain design solution from Coupa.
Vertex’s deployment of digital tools such as Warehouse Barcoding, Manufacturing Execution Systems (MES), and advanced scheduling platforms has delivered significant logistics gains cutting over a day from warehouse batch processing and reducing line changeovers from 19 to just 8 days.
Speaker: Brian Dooley, Director SC Navigator, AIMMS, and Paul van Nierop, Supply Chain Planning Specialist, AIMMS
This on-demand webinar shares research findings from Supply Chain Insights, including the top 5 obstacles that bog you down when trying to improve your network design efforts: Poor data quality. Don’t have the right tools/tools are too complex or expensive. Lack of skilled resources. Lengthy time to plan/execute.
For instance, fixed slotting strategies assign products to specific locations based on historical data rather than dynamic needs, and hardcoded rules assign specific tasks to workers based on static roles or zones, rather than dynamically allocating tasks based on workload or real-time conditions.
Enter the industrial data scientist, a new breed of data analyst with access to more industrial data than ever before and the advanced technology to translate that information into actionable intelligence. However, leveraging AI requires data science capability, which adds additional complexity to an already complex environment.
By analyzing real-time data from various sources, companies can make proactive decisions that improve collaboration among stakeholders, boost operational resilience, and increase customer satisfaction. Data privacy concerns are paramount, as AI systems rely on vast amounts of sensitive information.
Edge Hardware: The battle for edge hardware also intensified in 2024, as companies sought to deploy AI capabilities closer to the source of data. The goal of these platforms is to provide a versatile set of tools for training, validating, and deploying AI models across a wide range of use cases.
Research shows that the hiring process is biased and unfair. While we have made progress to solve this, it’s potentially at risk due to advancements in AI technology. This eBook covers these issues & shows you how AI can ensure workplace diversity.
An iGPU (integrated graphic processing unit) is a current example. We have all the connected planning data we get from blue Yonder, all of the product data we get from the product systems, all of the shipment information that’s coming in from the carriers, as well as risk information from Everstream and other sources.
These are not static dashboards or simple visualizationstheyre living, data-rich models of real-world operations. Traditional planning tools often lack the agility to respond in real time. Step 2: Map the Data Ecosystem Digital twins depend on data integrity. Thats where digital twins come in.
5G networks significantly improve data transmission speed, latency, and device connectivity, revolutionizing supply chain operations. This setup allows teams to collaborate in real time, sharing video and diagnostic data across geographies. Next lets look at technical capabilities and applications in the domain.
Increasing supply chain data visibility is a priority for logistics organizations looking to improve resilience. Supply chain recovery hinges on incorporating robust data analytics and other data-driven tools into business operations to increase efficiency, reduce costs and proactively manage risk.
Table of Contents [Open] [Close] Significance of Last-Mile Delivery Optimization Implementing Innovative Strategies The Role of Data Analytics Sustainability: A Necessary Focus 1. Data-driven approaches, such as predictive analytics, facilitate real-time adjustments in delivery operations. Electric and Alternative Fuel Vehicles 2.
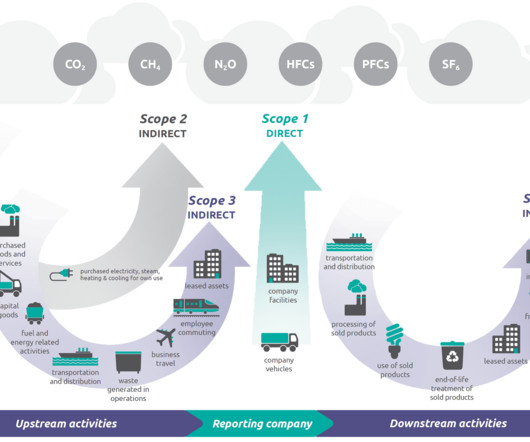
This added responsibility for companies will have lasting effects on business operations, corporate partnerships, supply chain logistics, compliance requirements, and data integrity. Regulations requiring Scope 3 emissions data from companies, create an end-to-end value chain reporting issue.
Most supply chain and logistics teams have recognized that the only way to combat todays incredible level of uncertainty is by adopting and applying digital tools. The pace and scope of supply chain disruption are beyond human cognition, manual analysis, and consumer-grade spreadsheet tools. billion to $23.07
To solve this problem, we’ll need to do three things: understand the data, aggregate the data, and define the constraints. First comes the data and how well we understand it. Do we have a demand forecasting tool in place and, if so, how good is that forecast? Can every customer get products from every warehouse?
Manufacturers rely on data and their ERP platform to answer critical questions: What are our inventory levels? Here’s an example. After all, data is the foundation of digital transformation, and according to McKinsey the pandemic caused companies to accelerate their digital transformation plans by three to four years.
Indeed, some organizations spent several years laying the foundations for data-driven strategy and remote operations even prior to COVID-19. Data-Driven Strategies Become Core Value Proposition. This core principle of creating value through logistics data has ricocheted throughout FedEx’s IT restructuring and its future plans.
Designed to integrate seamlessly with enterprise resource planning (ERP) systems through APIs and batch processes, the TMS facilitates smooth data flow and operational efficiency. These tools enhance transportation management by improving forecasting, optimizing logistics processes, and providing greater supply chain visibility.
This year, a recurring theme that I saw was about using supply chain data to improve the customer experience across the entire value chain. Here are the ones that stood out to me, especially as it relates to supply chain data. The single data cloud runs on Snowflake, one of Blue Yonder’s partners.
Uyghur Forced Labor Prevention Act (UFLPA) and the European Unions Forced Labor Regulation (FLR) are prime examples of this tightening framework. Businesses will need to ensure accurate data reporting across core operations such as sourcing, procurement, and transactions. Adding to the uncertainty, recent comments from a new U.S.
Lets break it down with some examples that hit home: Supplier Diversification : Reflecting on the disruptions caused by the pandemic, companies heavily reliant on Chinese suppliers faced significant challenges. For example, U.S.-based Its not about locking in decade-long deals or crossing your fingers that suppliers stay stable.
It is a brilliant tool.” SCCN solutions allow trading partners to collaborate across defined trading partner processes based on a common data model. For example, a buyer might say, “You only shipped me 800 of the 1000 products I ordered.” My advice,” he concluded, “is just jump in.
With the development of the digital wave, Robotic Process Automation (RPA) technology has gradually emerged as an important tool in the international logistics industry. Booking Processing : RPA can automatically scan and digitize booking documents in various formats and then automatically enter the data.
The real benefit of implementing an ERP system lies in integrating core business functions such as finance, inventory management, production and sales into a single, unifying platform that provides a business-wide view using centralized data. An ERP system can import and make use of other data such as that from IoT devices.
You’ve come to the right place if you’ve been wondering how to integrate modern technology into your business and what tools you’ll need. For example, an automated system can better organize delivery routes, saving fuel and time. I am sure by now you have heard of automation, but what is it really?
For example, our advanced 3PL platform looks after every aspect of your supply chain in an efficient, effective way and our Virtual Carrier Network safeguards your shipping by always applying the best rates and speeds while not handcuffing you to any carrier. Of course we’re talking about your ecommerce store’s data security.
Leading organizations are building supply chains that are less exposed to single points of failure, more informed by real-time data, and more able to adjust sourcing, inventory, and routing based on current conditions. These tools dont need to cover the entire network to be useful. What if lead times from a key port double?
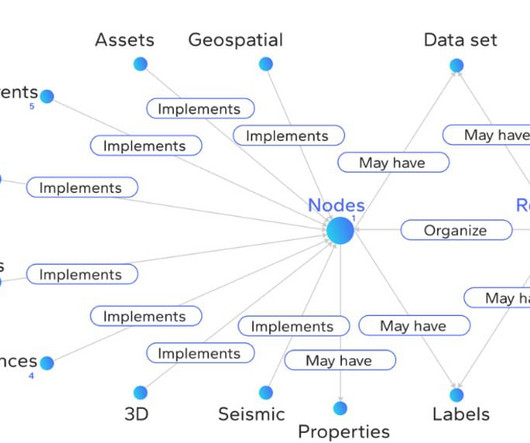
Knowledge Graphs are emerging as an important tool for building advanced AI capabilities. What Celanese has accomplished is the single best example ARC is aware of employing agentic AI and copilots at scale. We needed to model the data in a way that we can do simple searching. Data does not move. Celanese is an exception.
Solution: Use data-driven forecasting to predict demand as accurately as possible. Example: Retail giant Zara uses real-time data from its stores to adjust inventory dynamically. Embrace Automation for Efficiency Automation has proven to be a powerful tool for cutting supply chain costs across various industries.
For example, Maersk uses a digital twin a virtual replica of its terminals to simulate different scenarios and make data-driven decisions that improve efficiency and reduce risk. These AI tools allow companies to respond faster and more effectively to unexpected events.
AI systems get better and more accurate as they collect and analyze more data. ML is a form of AI that enables a system to learn from data rather than through explicit programming. ML is a form of AI that enables a system to learn from data rather than through explicit programming.
We organize all of the trending information in your field so you don't have to. Join 84,000+ users and stay up to date on the latest articles your peers are reading.
You know about us, now we want to get to know you!
Let's personalize your content
Let's get even more personalized
We recognize your account from another site in our network, please click 'Send Email' below to continue with verifying your account and setting a password.


Let's personalize your content