This site uses cookies to improve your experience. To help us insure we adhere to various privacy regulations, please select your country/region of residence. If you do not select a country, we will assume you are from the United States. Select your Cookie Settings or view our Privacy Policy and Terms of Use.
Cookie Settings
Cookies and similar technologies are used on this website for proper function of the website, for tracking performance analytics and for marketing purposes. We and some of our third-party providers may use cookie data for various purposes. Please review the cookie settings below and choose your preference.
Used for the proper function of the website
Used for monitoring website traffic and interactions
Cookie Settings
Cookies and similar technologies are used on this website for proper function of the website, for tracking performance analytics and for marketing purposes. We and some of our third-party providers may use cookie data for various purposes. Please review the cookie settings below and choose your preference.
Strictly Necessary: Used for the proper function of the website
Performance/Analytics: Used for monitoring website traffic and interactions
handles high-volume inbound and outbound calls, streamlining workflows and delivering real-time insights that empower human teams to focus on strategic, high-impact initiatives. About CloneOps CloneOps.ai is transforming phone operations with AI-powered solutions engineered for speed, scale, and efficiency. Integration Capabilities: CloneOps.ai
Shippers are shifting from East Coast to West Coast ports ahead of a potential strike, impacting logistics and transportation services. Continue reading →
The platform’s data-driven insights and yard management capabilities further optimize operations and support informed decision-making. Data-driven insights: Velostics platform provides valuable data analytics to optimize facility performance and improve operational efficiency.
The company’s platform integrates shipping details with data and algorithms to provide customers with information on expected delivery times, fulfillment speed, on-time performance, and outbound ship times. Greenscreens.ai’s dynamic pricing infrastructure built to grow and protect margins. The Greenscreens.ai
Unlocking cost reductions in logistics implies a direct need to improve warehouse and facility inbound logistics and outbound order fulfillment. The post Final Mile Integration: Data Enables Inventory Management & Replenishment appeared first on Transportation Management Company | Cerasis.
From sourcing and bid evaluation to warehouse slotting and dynamic routing, AI tools support faster and more consistent outcomes by processing large volumes of operational data and identifying patterns that human decision-makers may overlook. Integration allows seamless transitions from data insights to purchase approvals and execution.
They are designed for high-reach applications, capable of horizontal and vertical movement of payloads, and used for end-to-end applications, from inbound, replenish, and outbound tasks to all tasks in between. The data is accessible to state U.S. If found in violation, Temu could face fines of up to 6% of its global turnover.
Maintaining good compliance to these informational guides is critical to supply chain management and relies heavily on current data and automation. Missing data amounts to inevitable routing guide failures Data is king in today’s ever-changing market, and it is only becoming more vital for supply chain operations and management.
Data access and analysis continue to be essential to competitive operations within the process of monitoring rates and expenses in intermodal shipping lanes. Data access to see savings compared to truckload and other shipping methods. Data accuracy can and does impact freight transportation in a significant way.
Without appointment management capabilities in place, for example, facilities can easily become overwhelmed by a flood of phone calls and emails from carriers trying to schedule inbound or outbound pickups, as well as managing labour planning within the facility.
The abundant data sources can make the process of assessing the market more difficult than necessary. Shippers and carriers should make more definitive decisions in selecting their data sources. Because data sources matter to assess accurately and objectively the over the road trucking market. . Outbound tender rejections.
Reaching mutually beneficial service level agreements (SLA) or trade agreements depends on the access and utilization of current logistics data and a decent amount of preparation. Far too often, there is a severe lack of real-time logistics data to work with during this process. Download the White Paper.
Data represents an integral part of daily life for most people, and it is no different within the transportation industry. That insight into how freight logistics and optimization rely on data and understanding the full picture is critical to making the best improvements in supply chain route optimization too.
GetSett gathers and optimizes data from facilities, carriers and vendors to create a holistic view that adjusts to the latest intelligence for smarter task management, and updates each party accordingly. Data allows to fill that gap. The problem going outbound. Smarter schedules based on data. Plan not matching execution.
This week, learn how freight market participants, especially those freight parties who are executing refrigerated shipping moves, rely on SONAR indices that show reefer freight data and activity. What are the available refrigerated shipping indices in SONAR? The index is expressed as a percentage of loads rejected to total loads tendered.
This prevents any further outbound shipments of the potentially compromised inventory. Efficient data retrieval and reporting: Our Inventory Control and Quality Assurance (ICQA) teams were tasked with rapidly retrieving all relevant data associated with the recalled product.
Time slot management, while a critical solution for yards and warehouses, needs to be part of the larger supply chain network, which includes transportation execution, procurement, and real-time data for enhanced visibility. By using real-time data for tracking of assets on the move, warehouses can be better prepared for arriving trucks.
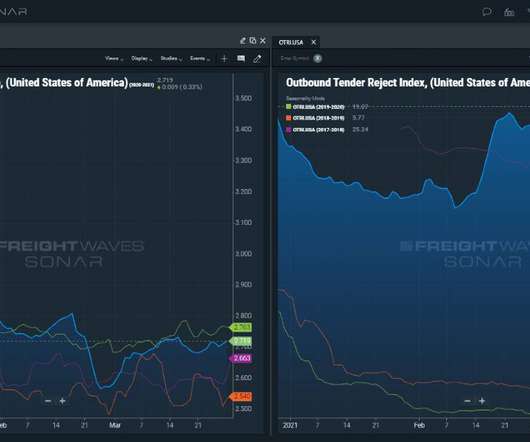
Within SONAR, the Outbound Tender Reject Index (blue) In early October eclipsed 5% for the first time since the Fourth of July holiday. At the same time, the Outbound Tender Volume Index (white) has yet to move meaningfully higher, despite record import levels. The post Prepping For The Retail Rush appeared first on SONAR.
According to data from supply chain visibility tech provider Project44, Florida will see a decline in truckload performance due to the damage and flooding, but rates leading up to Milton’s landfall were stable. Now those trucks are not where they thought they were going to be, so now we have to find other trucks there.
This accelerated fervor for The Zero Proofs products across both B2B and DTC customers strained their packout process which caused high outbound damage and mispick rates. From July through September of 2024, The Zero Proof outbound order volume grew by 86.9% year-over-year growth. for DTC and 173.3%
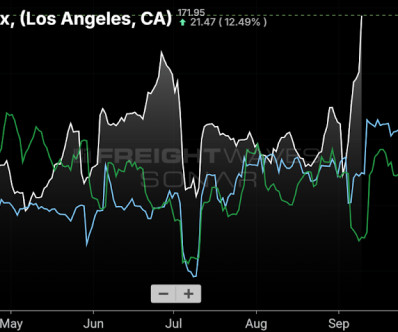
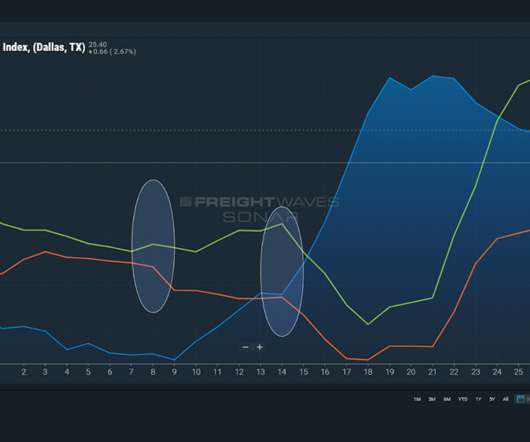
In the image below, use the following as your guide to interpreting: Blue = outbound tender rejections for the Dallas market, which measure service, capacity and price. Green = outbound volumes (demand). It shows outbound volumes increasing and inbound supply decreasing. Capacity signals for the freight market.
Quality and Detail of Data and its Analysis In some of our earlier posts, weve stressed the importance of simplicity in distribution network design , and we will return to that topic later in this article. It would be folly not to take advantage of data availability and accessibility.
As supply chains grow more intricate, this app provides a data-driven approach to balancing service levels and operational constraints, enabling businesses to build more efficient and resilient distribution networks. Min/Max Number of Centers Specify a range or an exact number of DCs based on operational constraints. STILL CURIOUS?
million outbound shipments per year. And, this was not because of the number of scenarios, but the initial quality of the data. Data cleaning took much longer than running the scenarios. The belief is that an 88-93% reduction in the CO2 footprint will occur on the outbound lanes once deliveries are made with eco-friendly EVs.
The current trends in maritime shipping data suggest increased shipment delays and further inflationary pressures on rates. The SONAR data platform offers the fastest and deepest set of freight market data on the planet. As capacity constraints remain prevalent, rates will continue to be driven higher. Request a SONAR Demo.
Advancements in tender data science and paid market data now power SONAR SCI (Supply Chain Intelligence) Lane Acuity Plus. In the screenshot above, you can see that the outbound and inbound stability show scores of 29 out of 100 and 21 out of 100, respectively. WHAT IS LANE ACUITY PLUS?
This “SONAR highlight reel,” which we plan to publish every other week, is intended to concisely hit data highlights and trends in truckload, intermodal and maritime. That has put intermodal further out of reach for spot shippers in the lanes outbound from L.A.
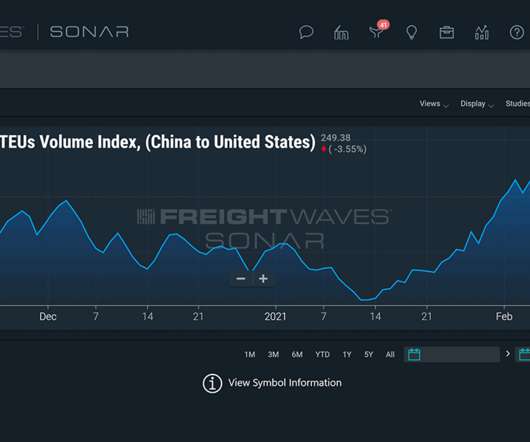
The Outbound Ocean TEU Index (OOTI) from Vietnam to the U.S. Outbound Air Cargo Tons out of Ho Chi Minh City are expected to grow leading into the holiday season as shippers rely heavily on air cargo. The SONAR data platform offers the fastest and deepest set of freight market data on the planet. Request a SONAR Demo.
Many companies have realized that their data lakes and homemade control towers aren’t providing the comprehensive overview they’d hoped for; although these systems enhance data richness within individual companies, they often struggle to incorporate and assimilate external data effectively due to a lack of standardization.
There is a profound difference between inbound and outbound logistics—inbound deals with the delivery of raw materials or goods coming into a business while outbound logistics refers to goods going out. Both inbound and outbound freight require carefully choreographed steps for a successful dance.
Transportation management systems are used by shippers and carriers to more efficiently manage inbound and outbound shipments. It is a unique solution that has attributes of different supply chain solutions – spot procurement functionality from a TMS, an RFP platform for contract planning, and a managed transportation data model.
Lack of data, lack of conviction and lack of organizational agility all conspire to keep companies from recognizing medium-term opportunities and challenges and responding decisively. It’s hard to find good data that provides a view into the next few months of consumer behavior and economic activity.
According to Derrick Steiner of Digitalist Magazine , “Today’s leading companies are working very hard to be intelligent enterprises, capable of harnessing the power of end-to-end experience and operational data, to connecting their demand chain with their customers, who are social, mobile and shop in many channels, to their supply chain.
Outbound tender rejection rates, a key indicator of freight market conditions, have climbed significantly, signaling a stronger pricing environment for carriers. Data-Driven Decision-Making in Freight Procurement Advanced Transportation Management Systems (TMS) enable: Carrier vetting and rate comparison.
This “SONAR highlight reel,” which we publish every other week, is intended to concisely hit data highlights and trends in truckload, intermodal and maritime. Spot rates continue to rise as freight flows to the spot market – particularly on the West Coast. These declines are concentrated in the outbound L.A.
Remember, it’s not all about outbound loads either. Usually, it’s a mix between inbound and outbound loads for shippers. What’s your mix between inbound and outbound loads? . FreightWaves SONAR provides the fastest freight market data in the world, across all major modes of traffic. You never know until you ask though.
These are inbound shipments from vendors, stock transfers between locations, and outbound shipments to customers. He also recommends looking at your inbound and outbound dock scheduling to better balance times to reduce dwell. He says since stock transfers are within the organization, they’re a good place to start. “If
Third-party supply chain and freight market data has become an important tool for retailers, manufacturers and suppliers who want to redesign their networks, improve strategic planning, benchmark their transportation spend and the service they’re getting in return, and measure the efficiency of their facilities.
The modern supply chain rests on a mountain of shipping data. However, the applications of real-time freight data remain disparate and lack value. Since on-time delivery accounts for both inbound and outbound freight , it has a natural effect on the full supply chain. It’s only challenging to get a handle on the volume.
Many receive emails alerting them of a data breach at their favorite mega-store or insurance company that exposed their personal information. Today, companies of all sizes are experiencing cyberattacks, leading to data breaches and system failures. We have safeguards in place to protect our sensitive data.
When freight market participants are able to get a leading indicator instead of historical data, they are able to proactively plan for assets needed, capacity, and the potential price of freight for drayage and surface transportation moves that head to inland markets after ocean shipments go from the port to roads. ports to China).
The Internet of Things (IoT) is a new, real-time digitalized system that enables sensing, data collection, and sharing. Outbound Logistics Track assets on their way to their final destination, providing customers and suppliers with up-to-the-minute ETA visibility. This innovative technology is transforming various industries.
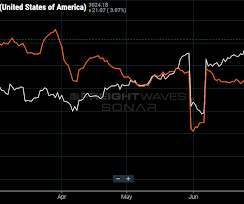
The data indicates that export volumes are going down month on month and import volumes are increasing, making it detrimental to the US economy and concerns have been raised by several quarters in the media. As per data from Shifl.com, the import rates did come down slightly at the end of October but seems to be rising slightly again. “
Digitizing the information fosters traceability and tracking of documents needed for trade, including material quality data sheets, import/export certificates, and more. Combined with the shipment criteria, complete supply chain visibility is achieved for both inbound and outbound material movements and product quality.
We organize all of the trending information in your field so you don't have to. Join 84,000+ users and stay up to date on the latest articles your peers are reading.
You know about us, now we want to get to know you!
Let's personalize your content
Let's get even more personalized
We recognize your account from another site in our network, please click 'Send Email' below to continue with verifying your account and setting a password.


Let's personalize your content