This site uses cookies to improve your experience. To help us insure we adhere to various privacy regulations, please select your country/region of residence. If you do not select a country, we will assume you are from the United States. Select your Cookie Settings or view our Privacy Policy and Terms of Use.
Cookie Settings
Cookies and similar technologies are used on this website for proper function of the website, for tracking performance analytics and for marketing purposes. We and some of our third-party providers may use cookie data for various purposes. Please review the cookie settings below and choose your preference.
Used for the proper function of the website
Used for monitoring website traffic and interactions
Cookie Settings
Cookies and similar technologies are used on this website for proper function of the website, for tracking performance analytics and for marketing purposes. We and some of our third-party providers may use cookie data for various purposes. Please review the cookie settings below and choose your preference.
Strictly Necessary: Used for the proper function of the website
Performance/Analytics: Used for monitoring website traffic and interactions
Maintaining good compliance to these informational guides is critical to supply chain management and relies heavily on current data and automation. Missing data amounts to inevitable routing guide failures Data is king in today’s ever-changing market, and it is only becoming more vital for supply chain operations and management.
One of the most popular tools that drives the supply chain to new heights is the process of intermodal freight shipping. Data access and analysis continue to be essential to competitive operations within the process of monitoring rates and expenses in intermodal shipping lanes. Download the White Paper.
As explained by Supply & Demand Chain Executive , “Digitization, software and giving shippers and carriers efficient tech tools are critical, as technology continues to modernize this industry. The abundant data sources can make the process of assessing the market more difficult than necessary. Download the White Paper.
A spot rate benchmarking tool has become an essential application for brokers, carriers and shippers to have at their fingertips. While being able to return a spot rate per mile on a lane is a valuable data point, the rate alone cannot paint a full picture of the market conditions that are influencing that rate up or down.
Data represents an integral part of daily life for most people, and it is no different within the transportation industry. That insight into how freight logistics and optimization rely on data and understanding the full picture is critical to making the best improvements in supply chain route optimization too.
Adding a Transportation Management System (TMS) with support for all modes and powerful optimization tools can be a great game plan to help shippers continue to gain efficiencies, reduce costs, and improve service to customers. The tool also allows shippers to save data and results in a single file for future use.
Shipping analytics tools shine a light on the value of informed freight management. Freight market participants need these top shipping analytics tools in their freight stack. Shipping status tools to track freight. Tracking shipment status is a core function of advanced shipping analytics tools. Download the White Paper.
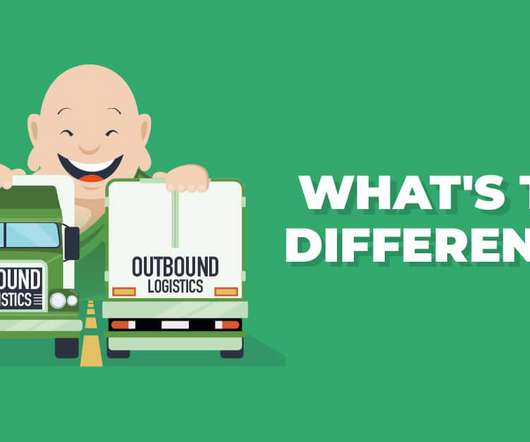
Today, we’re talking about the difference between inbound logistics and outbound logistics. At a glance, inbound logistics and outbound logistics refer to the different stages that goods go through while moving down the supply chain. Outbound Logistics. Best Ways to Optimize Inbound Logistics and Outbound Logistics Processes.
Quality and Detail of Data and its Analysis In some of our earlier posts, weve stressed the importance of simplicity in distribution network design , and we will return to that topic later in this article. It would be folly not to take advantage of data availability and accessibility.
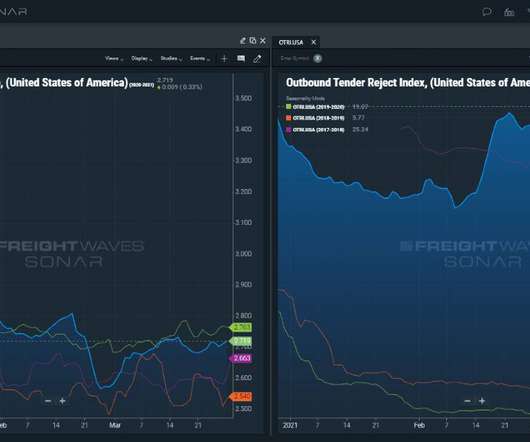
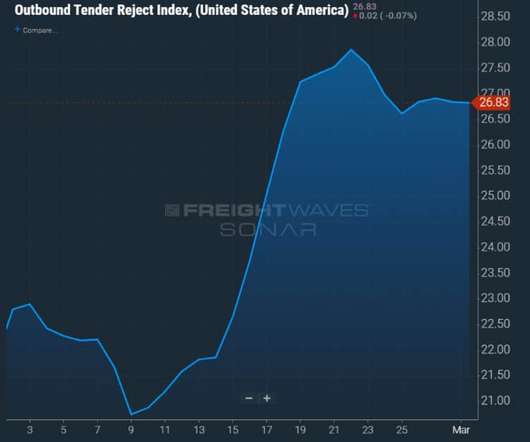
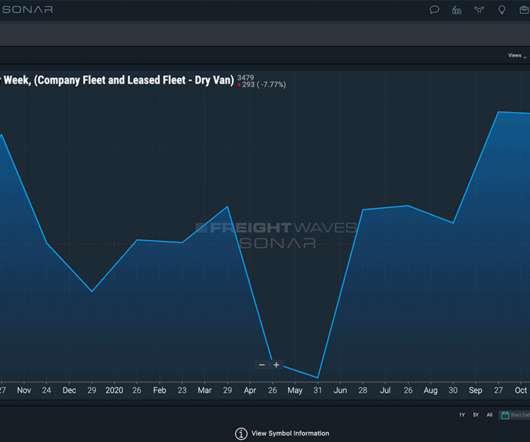
Within SONAR, the Outbound Tender Reject Index (blue) In early October eclipsed 5% for the first time since the Fourth of July holiday. At the same time, the Outbound Tender Volume Index (white) has yet to move meaningfully higher, despite record import levels. The post Prepping For The Retail Rush appeared first on SONAR.
This accelerated fervor for The Zero Proofs products across both B2B and DTC customers strained their packout process which caused high outbound damage and mispick rates. From July through September of 2024, The Zero Proof outbound order volume grew by 86.9% year-over-year growth. for DTC and 173.3%
Having experienced market growth in size and volume of tenders, Opus9 realized its existing freight market data intelligence tools were not giving their customers the best rate information. The post Opus9 delivers better service by applying SONAR data to stay competitive appeared first on SONAR. View the Full Case Study.
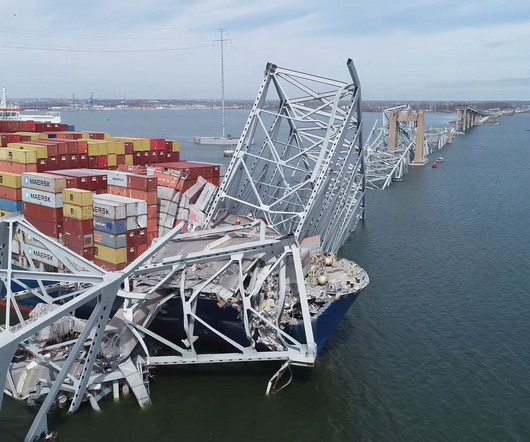
For example, an agile supply chain may have real-time data, advanced analytics, decision support tools, and cross-functional teams to monitor, diagnose, and solve problems. The port closure disrupts the inbound and outbound flows of vehicles and parts, affecting the operations and sales of automakers, dealers, and suppliers.
A leading indicator, Truckstop.com’s outbound tender rejection index (OTRI), currently stands at 22.48. Truckstop.com’s market data also shows that spot rates have gone up an average of 20%, year-over-year, for all freight sectors. Recently, the company began using the Book-It-Now digital freight matching platform from Trucker Tools.
There are different tools, goals, and market dynamics. The moves span inbound, intracompany, and outbound shipping. An RFP is a data intensive exercise. On the outbound side, they were using a transportation management system from e2open. This made the data analysis easier. This made the data analysis “painful.”
Advancements in tender data science and paid market data now power SONAR SCI (Supply Chain Intelligence) Lane Acuity Plus. In the screenshot above, you can see that the outbound and inbound stability show scores of 29 out of 100 and 21 out of 100, respectively. WHAT IS LANE ACUITY PLUS?
Should] you just figure out if it should be 5% or 6% [without data]?” Unlike other tools in the market, the Lane Signal considers an abundance of data from multiple sources, not just dirty data that flows through one system like other industry tools. SONAR is near-real-time data.
Real-time visibility and data into all things freight shipping is a supply chain gold standard. And nearly one-half of the industry’s freight market participants can see their data in real-time. Unfortunately, that doesn’t always amount to capturing real-time data outside of an individual company’s four walls. Now consider this.
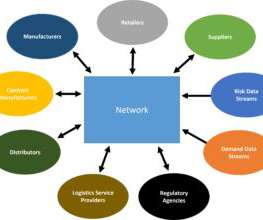
Companies “seeking to increase data sharing and collaboration across their supply networks have faced three principal hurdles.” A SCCN is a collaborative solution for supply chain processes built on a public cloud – many-to-many architecture – which supports a community of trading partners and third-party data feeds.
Whether you are looking to gain more customers, increase your company revenue size or add more trailers to your fleet, SONAR has information and data to help you with these decisions. OTVI was indexed at 10,000 on January 1, 2018, so when looking at this data set, the trend of the line is more important than the actual value.
Real-time visibility tools are generally most effective for over-the-road shipments. There are a variety of external data streams that also play a role in providing better visibility and improved ETAs. There are a variety of external data streams that also play a role in providing better visibility and improved ETAs.
Companies are rapidly adopting and using real-time data to clearly understand challenges to better mitigate unexpected problems when they arise. In fact, logisticians should consider these top five use cases of increased visibility and data within logistics and how they improve throughput.
Third-party supply chain and freight market data has become an important tool for retailers, manufacturers and suppliers who want to redesign their networks, improve strategic planning, benchmark their transportation spend and the service they’re getting in return, and measure the efficiency of their facilities.
Whether considering where to start or what they have to gain, most merchants find the necessary insights to move forward with business intelligence tools that mine their own fulfillment data and customer interactions. Critical data to track. Carrier invoice data (actual costs). Carrier-contracted rates.
With all the advances in technology and a continuous need to just do more with less, it’s imperative for shippers to start by assessing the quality of their basic data and analytics tools. According to PLS Logistics , “A routing guide is an essential tool for businesses seeking greater control over transportation decision-making.
Whether you are looking to gain more customers, increase your company revenue size or add more trailers to your fleet, SONAR has information and data to help you with these decisions. OTVI was indexed at 10,000 on January 1, 2018, so when looking at this data set, the trend of the line is more important than the actual value.
We learn how to use tools like Excel and Google Sheets out of necessity to organize the world around us. Once installed, everyone from boomers to Gen Alpha (if a 14-year-old has interest in logistics data) gains access to incorporate SONAR’s millions of data points into their day with nothing more than a user login and password.
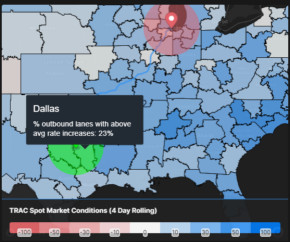
The WRI combines outbound tender market share (OTMS) and the weekly change in tender rejection rates (OTRIW). For example Atlanta’s OTMS value is 4% and outbound rejections increased from 3% to 5% over the past seven days. FreightWaves SONAR is the fastest and most comprehensive freight market data and analytics platform in the world.
This example generates a huge amount of data that can leverage in the supply chain. But, the same data can have a drastic impact on transportations planners and agencies around the globe. Today’s Status: Today, this technology is limited to automated identification and data capture (AIDC) applications.
Implementing the solution involved cleaning up master data and mapping their complete global supply chain. Risk management solutions scrape data from hundreds of thousands of online & social-media sites, but Autoliv also has access to sources of information that they pay for. The implementation was not trivial.
Zaro Transportation offers better service and data-driven rates due to SONAR among other initiatives to include: The company needed to emphasize its value to maintain profitability during disruption. Using SONAR’s Predictive Rates tool to generate accurate shippers’ prices and offering more competitive rates to LSPs and carriers.
The action: prioritize carriers within the routing guide based on which are preferred for shipments, depending on origin/destination data. What is a routing guide : a set of rules and requirements from shippers that set rules for inbound and outbound shipping. Request a SONAR SCI Lane Acuity demo by clicking the button below today. .
This involves using real-time data and technology to get information about manufacturing processes when and where it is needed, in the form it is needed, to empower smart decisions about business operations. For example, analyzing real-time production data to uncover hidden inefficiencies and implement changes faster.
Given that our proprietary TMS, the Cerasis Rater , provides multiple reports, giving our shippers’ many insights, this post is quite appropriate, just like getting the data that is meaningful , in order to make the best decisions for your business possible. . Outbound freight costs as percentage of net sales. On-time pickups.
RFID is a tool to read & understand digital data encrypted in RFID tags through a reader via radio waves. To understand it, we can take the example of a bar code or magnetic strip of a bank’s ATM card where data is captured by the device and stored in the database. Easy reports and advanced data analysis .
Let’s look at seven ways that freight technology and data achieves that goal. Freight data reduces dwell time and load time. New advances in data-driven transportation management help reduce dwell time impact by streamlining scheduling and avoiding bottlenecks in the yard. Data-driven processes streamline shipping.
The freight transportation industry has always been slow to adopt new advances in tools, software and automation. And to help carriers achieve that goal, this white paper will explore a few best practices to reduce operating costs, including: The importance of meaningful data capture. Tracking and applying equipment data insights.
Our analytics department is comprised by data scientists who work on developing AI models, as well as OR specialists who focus on Supply chain optimization, simulation and mathematical programming. Were you using other tools aside from spreadsheets, prior to using AIMMS? . I work for the analytics department within Tata Steel.
Thus, retailers must manage the whole process, including inbound and outbound freight, as an extension of the shopping experience. Customers’ Data Is Being Created, And It Requires Integration. In other words, data created must be used across multiple systems throughout the supply chain.
Such software and planning systems are also highly relevant for a wide range of purposes in outbound automotive logistics systems, including for the execution of transport activities and the creation of transparency in relation to distribution flows, increasing transport load rates and auditing freight invoice and payments.
Implementing new technology is a complicated process, but it can be simplified as follows: Integrate systems that control both inbound and outbound freight. Upgrade your WMS, taking advantage of systems capable of self-optimization and big data analytics. How to Implement New Warehouse Management Technology Successfully.
These tools give real-time visibility to various people internally and provide customers transparency over their goods while in our care. Data-driven Business Intelligence. While the WMS collects the raw data, the evans365 portal gives customers an interactive dashboard to observe trends. What metrics are important to customers?
But when supply chain leaders tackle these problems with digital tools, they find that resilience and responsiveness often go hand in hand. High quality data connected in the right way can dramatically improve the speed that information propagates through an organization and accelerate the cadence of decisions.
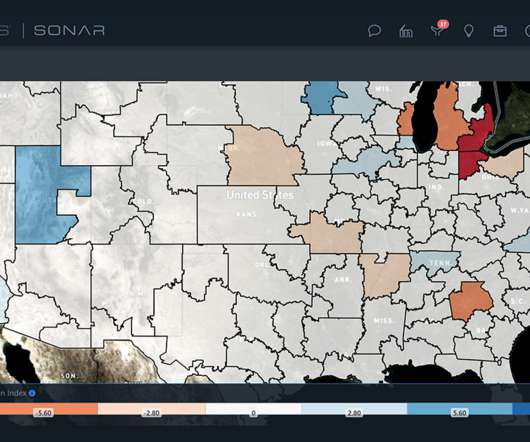
Market Dashboard Plus is a multi-lane management tool that provides context around origin and destination capacity conditions in relation to spot and contract rates. A low Lane Score indicates the flow of capacity into a given market is inbound-centric, while a high Lane Score indicates the flow of capacity is more outbound-centric.
We organize all of the trending information in your field so you don't have to. Join 84,000+ users and stay up to date on the latest articles your peers are reading.
You know about us, now we want to get to know you!
Let's personalize your content
Let's get even more personalized
We recognize your account from another site in our network, please click 'Send Email' below to continue with verifying your account and setting a password.


Let's personalize your content