This site uses cookies to improve your experience. To help us insure we adhere to various privacy regulations, please select your country/region of residence. If you do not select a country, we will assume you are from the United States. Select your Cookie Settings or view our Privacy Policy and Terms of Use.
Cookie Settings
Cookies and similar technologies are used on this website for proper function of the website, for tracking performance analytics and for marketing purposes. We and some of our third-party providers may use cookie data for various purposes. Please review the cookie settings below and choose your preference.
Used for the proper function of the website
Used for monitoring website traffic and interactions
Cookie Settings
Cookies and similar technologies are used on this website for proper function of the website, for tracking performance analytics and for marketing purposes. We and some of our third-party providers may use cookie data for various purposes. Please review the cookie settings below and choose your preference.
Strictly Necessary: Used for the proper function of the website
Performance/Analytics: Used for monitoring website traffic and interactions
handles high-volume inbound and outbound calls, streamlining workflows and delivering real-time insights that empower human teams to focus on strategic, high-impact initiatives. About CloneOps CloneOps.ai is transforming phone operations with AI-powered solutions engineered for speed, scale, and efficiency. Integration Capabilities: CloneOps.ai
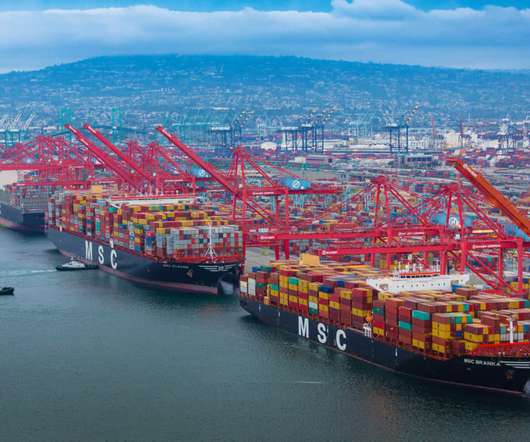
Shippers are shifting from East Coast to West Coast ports ahead of a potential strike, impacting logistics and transportation services. Continue reading →
Short-haul volume growth shines a light on current trucking trends. Understanding freight trends from the beginning of the supply chain all the way through to delivery is important for all parties involved. The current trends in maritime shipping data suggest increased shipment delays and further inflationary pressures on rates.
This is nearly double the amount from a decade ago and it seems to be in line with the trend of Halloween gaining popularity in the last few years with the help of social media. The data is accessible to state U.S. According to the S&P Global Market Intelligence Americans are spending upwards of 4.1
Data access and analysis continue to be essential to competitive operations within the process of monitoring rates and expenses in intermodal shipping lanes. Data access to see savings compared to truckload and other shipping methods. Data accuracy can and does impact freight transportation in a significant way.
Reaching mutually beneficial service level agreements (SLA) or trade agreements depends on the access and utilization of current logistics data and a decent amount of preparation. Far too often, there is a severe lack of real-time logistics data to work with during this process. Download the White Paper.
This trend, known as reshoring , is driving the emergence of regionalized freight networks , optimizing supply chains for efficiency, cost savings, and resilience. Outbound tender rejection rates, a key indicator of freight market conditions, have climbed significantly, signaling a stronger pricing environment for carriers.
Data represents an integral part of daily life for most people, and it is no different within the transportation industry. That insight into how freight logistics and optimization rely on data and understanding the full picture is critical to making the best improvements in supply chain route optimization too.
This example generates a huge amount of data that can leverage in the supply chain. But, the same data can have a drastic impact on transportations planners and agencies around the globe. Today’s Status: Today, this technology is limited to automated identification and data capture (AIDC) applications. Additive Manufacturing –.
This week, learn how freight market participants, especially those freight parties who are executing refrigerated shipping moves, rely on SONAR indices that show reefer freight data and activity. What are the available refrigerated shipping indices in SONAR? The index is expressed as a percentage of loads rejected to total loads tendered.
The application of data can help shippers gain control of shipping costs and make informed decisions, and the top freight datatrends for 2019 exemplify how the use of a transportation management system (TMS) can further this cause. As omnichannel shopping becomes the standard for consumers, the use of freight data will excel.
I recently completed a survey with Transporeon on the importance of time slot management solutions and interviewed Transporeon’s CEO Stephan Sieber to get more insight into the trends in time slot management. By using real-time data for tracking of assets on the move, warehouses can be better prepared for arriving trucks.
FreightWaves SONAR is releasing new indices – Capacity Trend Market Scores and Capacity Trend Market Direction – to help shippers, carriers and brokers prioritize specific routes daily. Capacity Trend Market Scores Capacity Trend Market Scores are divided into two perspectives – shipper/broker and carrier.
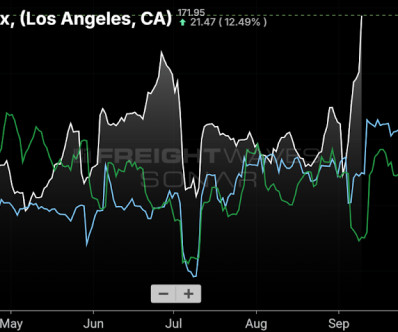
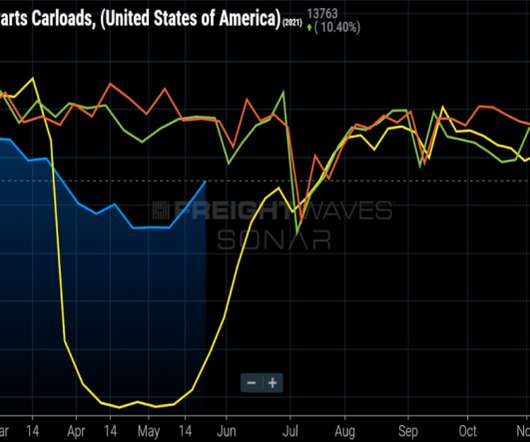
This “SONAR highlight reel,” which we plan to publish every other week, is intended to concisely hit data highlights and trends in truckload, intermodal and maritime. That has put intermodal further out of reach for spot shippers in the lanes outbound from L.A.
This “SONAR highlight reel,” which we publish every other week, is intended to concisely hit data highlights and trends in truckload, intermodal and maritime. Spot rates continue to rise as freight flows to the spot market – particularly on the West Coast. These declines are concentrated in the outbound L.A.
According to Derrick Steiner of Digitalist Magazine , “Today’s leading companies are working very hard to be intelligent enterprises, capable of harnessing the power of end-to-end experience and operational data, to connecting their demand chain with their customers, who are social, mobile and shop in many channels, to their supply chain.
Advancements in tender data science and paid market data now power SONAR SCI (Supply Chain Intelligence) Lane Acuity Plus. In the screenshot above, you can see that the outbound and inbound stability show scores of 29 out of 100 and 21 out of 100, respectively. WHAT IS LANE ACUITY PLUS?
Relying on proactive rather than reactive analytics, and the ability to make specific actionable callouts from these data sets, will be key to navigating the ever-changing shipping landscape both now and in the future. The key is knowing how to use this data most effectively so as not to miss avoidable problems or raise unnecessary red flags.
The answer is simple; shippers must track the right data. Knowing the proper metrics and data points to track promotes cost-effective shipping practices and can improve vendor, carrier and consumer relationships, reports Merrill Douglas of Inbound Logistics. Thus, shippers can identify trends toward lower-rate carriers over time.
However, manufacturers must also look beyond systems and software, uncovering how better processes and strategy can enhance operation through these additional trends. Manufacturers Looks to Reduce the Skills Gap, a Consistent Issue When Talking Trends in American Manufacturing. The Dominance of E-Commerce Continues.
More freight brokers are turning to technology and transportation data to grow their businesses by understanding the true freight market rate. . It’s not solely about knowing basic rates – it’s about using freight data to make the best decisions for all loads – playing both the buy-side and sell-side aspects of freight brokering.
Since this trend isn’t likely to change anytime soon, shippers who can contain the cost of shipping by maximizing efficiency and optimization throughout their shipping network will be on firm ground heading into the future. Data-driven analytics enables you to make cost-effective transportation decisions. DOWNLOAD WHITEPAPER.
Lack of data, lack of conviction and lack of organizational agility all conspire to keep companies from recognizing medium-term opportunities and challenges and responding decisively. It’s hard to find good data that provides a view into the next few months of consumer behavior and economic activity.
SONAR data show that the freight market for inbound Detroit loads is highly volatile based on auto production trends – inbound Detroit loads should be less expensive when OEMs are sourcing a lot of components as assembly volumes ramp up. There is typically more demand for inbound truckloads into Detroit than outbound truckloads.
Should] you just figure out if it should be 5% or 6% [without data]?” Unlike other tools in the market, the Lane Signal considers an abundance of data from multiple sources, not just dirty data that flows through one system like other industry tools. SONAR is near-real-time data.
The data indicates that export volumes are going down month on month and import volumes are increasing, making it detrimental to the US economy and concerns have been raised by several quarters in the media. As per data from Shifl.com, the import rates did come down slightly at the end of October but seems to be rising slightly again. “
SONAR tender data and TRAC (Trusted Rate Assessment Consortium) spot rates can really set you apart from the competition when talking to your customers. All of these indices contain data as far back as 2018, enabling you to see daily changes as well as historical yearly patterns and trends. The post Where Is the Freight?
The Outbound Ocean TEU Index (OOTI) from Vietnam to the U.S. Outbound Air Cargo Tons out of Ho Chi Minh City are expected to grow leading into the holiday season as shippers rely heavily on air cargo. The SONAR data platform offers the fastest and deepest set of freight market data on the planet. Request a SONAR Demo.
It’s a software that uses close to real-time data to give companies a picture of upcoming demand. An article of demand sensing by Supply Chain Brain explains, Demand sensing, as the name implies, is essentially the art and science of picking up on short-term trends immediately, in order to better predict what consumers will want.
Rate data is available for Van (TSTOPVRPM), Reefer (TSTOPRRPM) and Flatbed (TSTOPFRPM) modes. . While SONAR has other indices for rate data, Truckstop.com data is important as many small to medium (and some large) brokerages rely on the site to source carriers. You can view data in weekly, bi-weekly, monthly and annual changes.
And just in time: We’ve seen some interesting bidding trends over the last year or so, especially in the domestic trucking industry, where: 2017-2018’s lack of trucking capacity—a large part of shippers’ bidding activity—meant shippers went to bid not only earlier, but in much greater volume than previous years (a 15% YOY increase in 2018).
And just in time: We’ve seen some interesting bidding trends over the last year or so, especially in the domestic trucking industry, where: 2017-2018’s lack of trucking capacity—a large part of shippers’ bidding activity—meant shippers went to bid not only earlier, but in much greater volume than previous years (a 15% YOY increase in 2018).
Of course, the big challenge in this type of external benchmarking is obtaining the necessary data, since many companies are wary of sharing performance data with potential competitors. Instead, its merely a common-sense guide to those supply chain KPIs that can best provide actionable data for general management purposes.
And just in time: We’ve seen some interesting bidding trends over the last year or so, especially in the domestic trucking industry, where: 2017-2018’s lack of trucking capacity—a large part of shippers’ bidding activity—meant shippers went to bid not only earlier, but in much greater volume than previous years (a 15% YOY increase in 2018).
Third-party supply chain and freight market data has become an important tool for retailers, manufacturers and suppliers who want to redesign their networks, improve strategic planning, benchmark their transportation spend and the service they’re getting in return, and measure the efficiency of their facilities.
Whether you are looking to gain more customers, increase your company revenue size or add more trailers to your fleet, SONAR has information and data to help you with these decisions. OTVI was indexed at 10,000 on January 1, 2018, so when looking at this data set, the trend of the line is more important than the actual value.
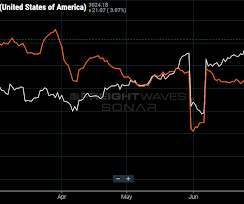
The national Outbound Tender Volume Index (OTVI) — a measure of the electronic requests for truckload capacity from shipper to carrier — is up nearly 7% versus month-ago levels,” Zach Strickland, FreightWaves’ head of freight market intelligence, reported earlier this month. A late-summer demand spike, however, is altogether unexpected. “The
In addition, returns typically cost more to handle than outbound shipments – 3 to 4 times more for traditional retail companies, for example. As market and buying trenddata becomes more abundant and IT systems more connected, retailers can better estimate demand and adapt their ordering. Forecast demand better.
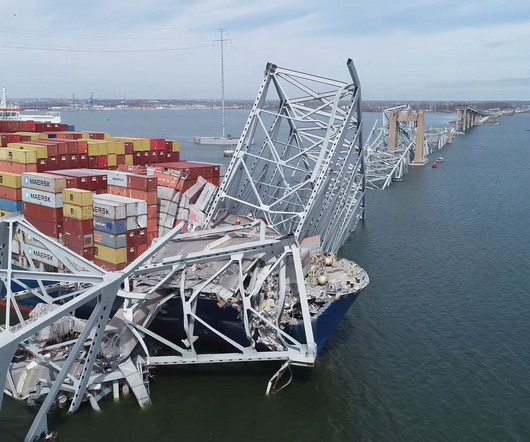
For example, an agile supply chain may have real-time data, advanced analytics, decision support tools, and cross-functional teams to monitor, diagnose, and solve problems. The port closure disrupts the inbound and outbound flows of vehicles and parts, affecting the operations and sales of automakers, dealers, and suppliers.
However, with the ongoing pandemic, and the resulting capacity crunch, TMS is trending more towards cost mitigation rather than savings. The new solution no longer requires data to be passed between WM and TM as the two run as a unified application on Manhattan Active technology. From a user experience standpoint, this is important.
Digitizing the information fosters traceability and tracking of documents needed for trade, including material quality data sheets, import/export certificates, and more. Combined with the shipment criteria, complete supply chain visibility is achieved for both inbound and outbound material movements and product quality.
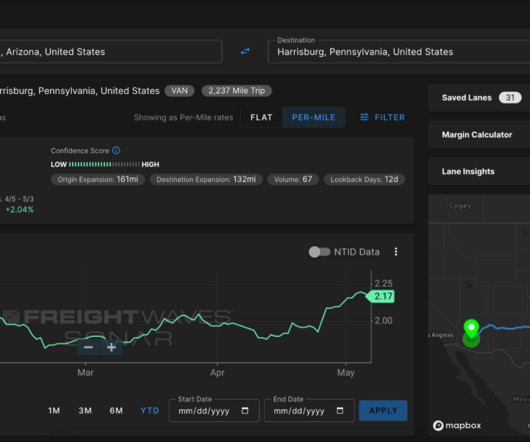
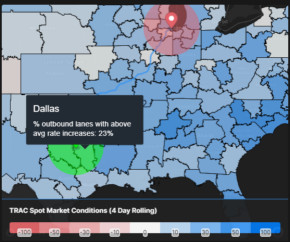
While being able to return a spot rate per mile on a lane is a valuable data point, the rate alone cannot paint a full picture of the market conditions that are influencing that rate up or down. For brokers, the Market Conditions map helps identify which outbound markets are showing overall increases in rates.
Using SONAR data in contract negotiations with carriers and 3PLs. . The retailers that performed the best over the past year were generally the ones that sold essential goods, such as food, or benefited from the trends of the hour, such as home repair. Identify surface transportation trends being driven by U.S.
By the 1960s, a clear trend had developed in shifting more time-dependent freight transportation to truck rather than rail. Academic research and education followed this trend to satisfy the growing industry recognition of the needs in this area. Prior to the 1960s, virtually all transactions and record keeping were done manually.
We organize all of the trending information in your field so you don't have to. Join 84,000+ users and stay up to date on the latest articles your peers are reading.
You know about us, now we want to get to know you!
Let's personalize your content
Let's get even more personalized
We recognize your account from another site in our network, please click 'Send Email' below to continue with verifying your account and setting a password.


Let's personalize your content