This site uses cookies to improve your experience. To help us insure we adhere to various privacy regulations, please select your country/region of residence. If you do not select a country, we will assume you are from the United States. Select your Cookie Settings or view our Privacy Policy and Terms of Use.
Cookie Settings
Cookies and similar technologies are used on this website for proper function of the website, for tracking performance analytics and for marketing purposes. We and some of our third-party providers may use cookie data for various purposes. Please review the cookie settings below and choose your preference.
Used for the proper function of the website
Used for monitoring website traffic and interactions
Cookie Settings
Cookies and similar technologies are used on this website for proper function of the website, for tracking performance analytics and for marketing purposes. We and some of our third-party providers may use cookie data for various purposes. Please review the cookie settings below and choose your preference.
Strictly Necessary: Used for the proper function of the website
Performance/Analytics: Used for monitoring website traffic and interactions
In this article, we will explore these last-mile delivery optimization strategies and the role of route optimization software as we look ahead to industry trends shaping the future of delivery in 2025. GET A FREE DEMO The Role of Data Analytics Data analytics plays a vital role in last-mile delivery route optimization.
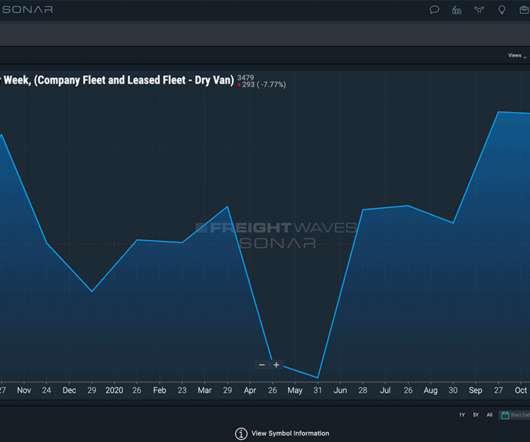
Here’s how it works: We start with a 2-year average for each calendar month , for example, July is averaged from July 2023 and July 2024, to capture the typical seasonal flow. So if the market this year is trending higher than usual, your projection line will shift upward. If it’s underperforming, it adjusts down.
This solution allows human resource managers to review performance against over 50 external workforce key performance indicators, access global market intelligence (including rates, talent supply and demand, and time-to-hire trends), and track progress across diversity and worker health and safety initiatives.
Here’s how it works: We start with a 2-year average for each calendar month , for example, July is averaged from July 2023 and July 2024, to capture the typical seasonal flow. So if the market this year is trending higher than usual, your projection line will shift upward. If it’s underperforming, it adjusts down.
For example, commercial pest control operators benefit from centralized data management and scheduling tools, transforming everyday operations into more scalable and compliant processes. For example, pest control reporting tools allow managers to adjust team scheduling and allocate resources to areas requiring immediate attention.
Many LTL industry trends, including capacity limitations, increasing accessorials, surcharge rates, changes in market trends and buying patterns, are almost certain to continue through 2021 and for some time to come. In this example, the shipping rate would be based on the DIM pricing weight of eight pounds.
According to EFT’s Supply Chain Hot Trends to Watch for in 2019 , one of the most significant trends that we should be paying attention to this year is automation. Judging by the speed with which the industry embraces new technological trends, there will undoubtedly be some obstacles to overcome before it becomes prevalent.
Below, we dive into their key takeaways and explore five practical ways to make your logistics data actionable, with insights grounded in industry trends and high-authority sources. This holistic approach enables real-time decision-making, such as issuing spot requests when market trends shift, as supported by Freightos’ procurement tools.
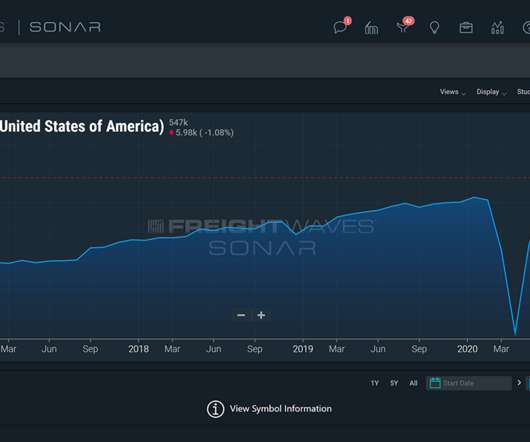
This week, learn how freight market participants are predicting shifts in the freight market that may occur with changes in retail sales trends using the SONAR index, Retail Sales with the ticker name of RESL. The RESL index is a monthly measurement of retail sales trends provided by the U.S. for year-over-year breakouts): .
Similarly, shifts are evident in ocean and air cargo rates, driven by geopolitical actions and seasonal trends. Brokers benefit from tracking capacity and pricing trends, maintaining their significance in the supply chain ecosystem. To learn more about SONAR, visit gosonar.com or request a demo.
The examples below show you how to do this in AIMMS SC Navigator Apps, but we encourage you to study these scenarios in the tools you have at your disposal. . Study 2: Inspect Demand Trends . Using Demand Forecasting Navigator to Study Demand Trends. Demo in Network Design Navigator . Understand Exposure .
For the most part, the retail market for fresh foods thrived throughout the pandemic, according to the Supermarket News 2021 Fresh Foods Trends Report. As one respondent said, “COVID just woke us up to a trend that had already been occurring. This is another example of the ongoing digitization of supply chains.
Turvo’s platform, for example, offers real-time insights into carrier performance, cost per lane, and shipment status. With intuitive dashboards and customizable KPIs, teams can monitor trends, diagnose issues, and optimize performance—all from one unified interface. Ready to turn your logistics data into a competitive edge?
More Resources Home November 21, 2023 Update The Freightos Weekly Update helps you stay on top of the latest developments in international freight by giving you the rundown on the latest economic data, ocean and air demand trends, rate data – and anything else impacting the market.
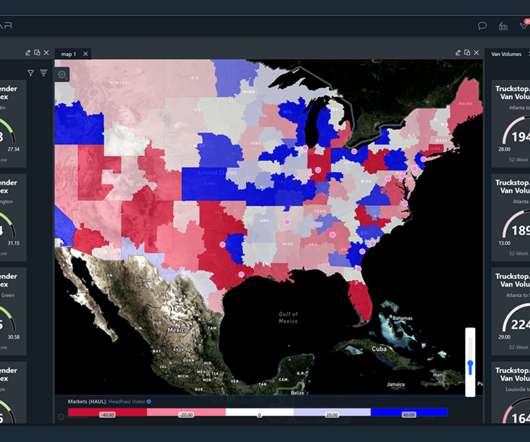
FreightWaves SONAR is releasing new indices – Capacity Trend Market Scores and Capacity Trend Market Direction – to help shippers, carriers and brokers prioritize specific routes daily. Capacity Trend Market Scores Capacity Trend Market Scores are divided into two perspectives – shipper/broker and carrier.
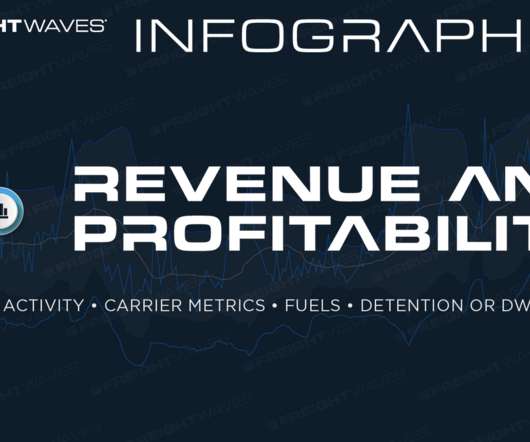
Market activity describes the nationwide and granular trends affecting available capacity, timeliness of transit and on-time, in-full deliveries. Since transportation is literally a fuel-consuming industry, knowing the fuel changes and trends will go a long way to improve trucking profitability. Request a SONAR Demo.
More Resources Home November 7, 2023 Update The Freightos Weekly Update helps you stay on top of the latest developments in international freight by giving you the rundown on the latest economic data, ocean and air demand trends, rate data – and anything else impacting the market.
Consider this example. Yes, AI and machine learning build on algorithms to isolate historical trends and derive a likely transportation rate. And the past data trends are obsolete and rapidly becoming more so. Consider this example. . Request a SONAR Demo. But that principle does allude to another issue.
Take this example reported by Richard Davis in Supply & Demand Chain Executive , “It’s 7:00 p.m., While that’s an example of a particular warehouse, it has a natural implication for carriers. Consider the following example. Get started by requesting a FreightWaves SONAR demo or clicking the button below.
The process usually includes analyzing historical data for seasonal trends and product performance, as well as gathering current data on competitors, marketplace trends, future marketing plans and promotions. Creating graphs and pie charts out of your numerical data can make it easier to spot trends and gain insights.
And as reported by Supply Chain 24/7 , “Leveraging technology, shippers are able to see regional trends and specific lane cost information, as well as driver preferences, while carriers have access to details like loading/unloading times and lane history data.” Request a SONAR Demo. Request a SONAR SCI Demo.
More Resources Home December 6, 2023 Update The Freightos Weekly Update helps you stay on top of the latest developments in international freight by giving you the rundown on the latest economic data, ocean and air demand trends, rate data – and anything else impacting the market.
Real-World Example: Optimizing a Growing Supply Chain with the Right Tools 5. This is one of the most common questions in logistics – and for good reason. Get bi-weekly updates on supply chain trends, strategies, and hot topics, including sustainability, to stay ahead in the game. Book a Demo STILL CURIOUS?
As an example for these negotiating capabilities, let’s take a look at the following lane, Los Angeles, CA to Dallas, TX. With the port congestion issues we have been dealing with in LA, and the lack of outbound and inbound shipments in Dallas due to recent weather trends, these signals are not surprising. .
For example, according to Global Trade Magazine , “One critical factor that executives should monitor closely is logistics management. Without excellent and clear communication, these trends will not be identified and acted upon until it is too late. The costs of logistics as a ratio of total expenses are too significant to ignore.
Include data on industry trends, growth projections and customer demand. For example, the global courier and local delivery services market is expected to grow at a CAGR of 4.7% GET A FREE DEMO The post Create a Winning Business Plan for Your Delivery and Transportation Business In 8 Steps appeared first on WorkWave.
We will discuss case studies, future trends, and guidelines for businesses considering whether to invest in this cutting-edge technology. GET A FREE DEMO Challenges and Limitations of Drone Usage Drones for pest control offer significant potential, yet face a range of challenges and limitations. Book your free demo today!
As an example, explains Trade Gecko , fleet managers should “choose a 3PL that can handle your current volume, but that also will be ready to handle your volume if you suddenly add a bunch of new stock, increase your stock volumes, or have a great spike in sales. Request a FreightWaves SONAR demo by clicking the button below. .
For example, a few ways to apply FreightWaves SONAR data to enhance RFP processes for contract freight and still leverage spot market moves include: Ability to tailor shipping freight rates to meet the unique conditions of all 135 freight markets. . Request a FreightWaves SONAR demo by clicking the button below. Request a SONAR Demo.
For example, the Outbound Tender Volume Index (OTVI) is a 7-day moving average of shippers’ requests for capacity. Request a SONAR Demo. Request a SONAR SCI Demo. FreightWaves SONAR platform highlights many of the changing market dynamics surrounding weather events.
More Resources Home June 4, 2024 Update The Freightos Weekly Update helps you stay on top of the latest developments in international freight by giving you the rundown on the latest economic data, ocean and air demand trends, rate data – and anything else impacting the market.
Trends: Product demand is influenced by fashion, technology, social, economic and legal factors. Look out for such trends in your historical demand data and adjust your forecasts accordingly. For example, you should consider setting different service levels, safety stock levels and reordering parameters for each category.
More Resources Home May 1, 2024 Update The Freightos Weekly Update helps you stay on top of the latest developments in international freight by giving you the rundown on the latest economic data, ocean and air demand trends, rate data – and anything else impacting the market.
More Resources Home June 25, 2024 Update The Freightos Weekly Update helps you stay on top of the latest developments in international freight by giving you the rundown on the latest economic data, ocean and air demand trends, rate data – and anything else impacting the market.
The examples below show you how to do this in AIMMS SC Navigator Apps, but we encourage you to study these scenarios in the tools you have at your disposal. . Study 2: Inspect Demand Trends . Using Demand Forecasting Navigator to Study Demand Trends. Demo in Network Design Navigator . Understand Exposure .
The data collected over time allows for trend analysis, enabling continuous route optimization for improved efficiency. For example, integrating your GPS device with route optimization software enables managers to monitor whether drivers exceed speed limits, thus reinforcing safety protocols and reducing the likelihood of accidents.
For example, the Freightos Baltic Index indicates a 69% increase to North America’s East Coast and a staggering 226% to Northern Europe since the crisis began. It converged with a trend of both airlines and ocean liners investing far more heavily in their fleets over the past fewyears.
That combines to help enterprises define and assess their ranking among peers by avoiding dairy to automotive comparison as an example, identify issues within existing bids, recognize the contributing factors affecting lane stability, apply seasonality and accessorials. Knowing the trends of the lanes can help widen their margins. .
And if wait times do grow too long, carriers can turn to freight data to show general trends and bill detention charges accordingly. After all, trends, lane shifts, throughput and transparency data can now be used to make more hauls and avoid unexpected costs or delays. . Request a SONAR Demo.
As an example, rolled cargo could result in additional delays that add to a higher detention and demurrage risk for freight brokers and truckload providers. More insight into overall trends in volume and rates lowers risk overall. Learn more about how your organization can do the same by requesting a SONAR demo via the button below.
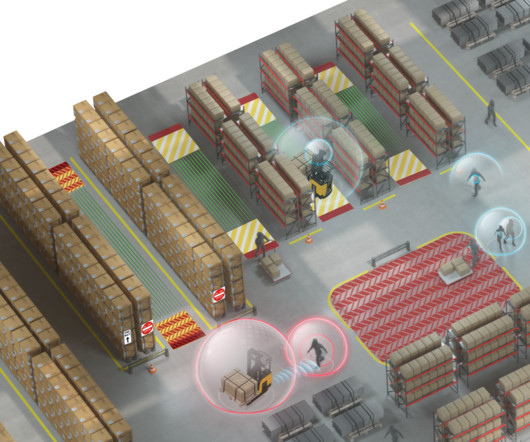
At LogiMAT, visitors can see a live demo of Yale Reliant, a system that can continually monitor people, trucks and loads and can recognise and help avoid hazards. Examples include if the operator lifts a load above recommended heights or where there is increased pedestrian traffic, obstacles or other hazards.
It’s the reason why more than 300 people attended this year’s Shipper Symposium: to learn about the trends shaping the industry and to discuss how to rewrite the rules for success moving forward. Adrian Gonzalez and Dan Dershem Talking Tech Trends. Here are some of the highlights, beginning with the session I participated in.
See an example of ABC analysis in action here. For example, you may want to focus on improving the service levels of your A class products, over your Bs and Cs by increasing your safety stock levels. In a marketplace where trends come and go and product sales can be erratic, items can move from category C to A very quickly.
For example: If there were 10 national loads tendered on March 1st and on March 2nd there were 11 tendered loads, the March 1st OTVI.USA value would be 10,000 and the March 2nd value would be 11,000. Example : ROTVI.ATL was 250 as of August 1. Get a demo of SONAR to see what the platform can do for you. Request a SONAR Demo.
We organize all of the trending information in your field so you don't have to. Join 84,000+ users and stay up to date on the latest articles your peers are reading.
You know about us, now we want to get to know you!
Let's personalize your content
Let's get even more personalized
We recognize your account from another site in our network, please click 'Send Email' below to continue with verifying your account and setting a password.


Let's personalize your content