This site uses cookies to improve your experience. To help us insure we adhere to various privacy regulations, please select your country/region of residence. If you do not select a country, we will assume you are from the United States. Select your Cookie Settings or view our Privacy Policy and Terms of Use.
Cookie Settings
Cookies and similar technologies are used on this website for proper function of the website, for tracking performance analytics and for marketing purposes. We and some of our third-party providers may use cookie data for various purposes. Please review the cookie settings below and choose your preference.
Used for the proper function of the website
Used for monitoring website traffic and interactions
Cookie Settings
Cookies and similar technologies are used on this website for proper function of the website, for tracking performance analytics and for marketing purposes. We and some of our third-party providers may use cookie data for various purposes. Please review the cookie settings below and choose your preference.
Strictly Necessary: Used for the proper function of the website
Performance/Analytics: Used for monitoring website traffic and interactions
Key Takeaways: The Right Tech Stack for Brokers Dave Romanchuk and Joe Lynch discuss the right tech stack for brokers: TMS CRM 3 rd Party Service Provider Integrations including, but not limited to carrier onboarding, pricing – buy and sell side, visibility, fraud, cybersecurity, load settlement (payments, proof of delivery, etc.)
Kevin is the Vice President of Sales at Greenscreens.ai , a technology that provides predictive pricing recommendations for maximum broker margins. is a pricing platform specifically tailored for the truckload spot freight market. offers real-time market price predictions that take into account the buying power of your company.
They explore the strategies for scaling these operations, the challenges of managing cash flow and capital, and the transformative impact of technology in the industry. While leading Product at Denim, he has pioneered new capabilities for the factoring space including risk automation and pricing.
The Amplio solutions ensure that you have the inventory you need, when you need it, at the most optimized price so that you can focus on what matters most to you and your business. Schedule an Amplio Demo. Key Takeaways: The Amplio Story. Learn More The Amplio Story. Trey Closson on LinkedIn. Amplio on LinkedIn.
billion rate data points monthly to provide the most comprehensive view of the market, helping you identify savings opportunities and make data-driven decisions. It creates a single source of truth for your rate management, automating RFQs and streamlining the entire procurement process. Ready to Transform Your Freight Operations?
Adjusting current logistics strategies demonstrated the second great challenge of the pandemic. Embracing new and improved logistics strategies remains the best way to adapt to clients’ changing demands in 2021 and beyond. Strong and versatile logistics strategies depend on this data. Download the White Paper.
Flexibility in a Volatile Market: As pricing and freight capacity fluctuate, procurement professionals need to adjust rates quickly without lengthy RFP processes. Partnership-First Approach: By eliminating the burden of frequent, large-scale tenders, shippers preserve key relationships with providers, ensuring collaboration over competition.
Figuring out how to improve annual request for proposal (RFP) bidding strategies remains elusive for many shippers, especially in the context of knowing when to expand the network to leverage freight consolidation. Why are shippers turning to freight consolidation to reduce transportation spend? Request a SONAR Demo.
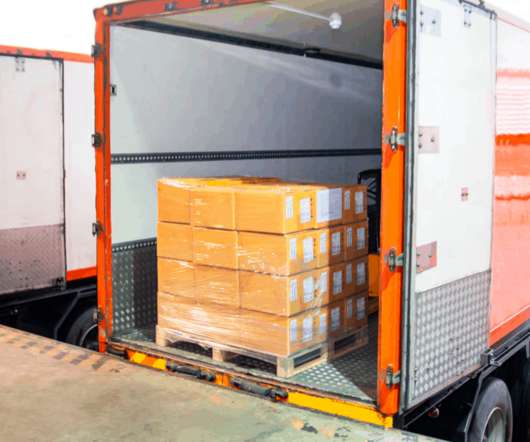
Inventory Replenishment Strategies to Boost Profitability. To overcome all these inventory management risks, you need a toolbox of effective inventory replenishment strategies. 5 Inventory Replenishment Strategies to Increase Profits. Can a longer lead time be covered by safety stock in order to negotiate a lower unit price?
Health-related absenteeism has resulted in reduced output, while transportation delays are echoing the freight challenges seen during the height of the COVID-19 pandemic. Logistics Delays: Reduced driver availability and stricter health regulations at ports could add days to delivery schedules. Whats Happening?
Judah Levine October 15, 2024 Weekly highlights Ocean Rates – Freightos Baltic Index Asia-US West Coast prices (FBX01 Weekly) fell 3% to $5,565/FEU. Asia-US East Coast prices (FBX03 Weekly) climbed 1% to $6,787/FEU. Europe prices (FBX11 Weekly) fell 11% to $3,625/FEU. America weekly prices decreased 23% to $5.43/kg.
We will discuss case studies, future trends, and guidelines for businesses considering whether to invest in this cutting-edge technology. This proactive approach reduces the reliance on intensive control measures, allowing for more efficient pest management strategies.
SourceDay automates PO line changes which eliminates manual work with email, spreadsheets, phone calls and text messages. As a result, companies can reduce late shipments, inventory carrying costs, pricing discrepancies, and out of stock issues. SourceDay Demo Video. Learn More About The SourceDay Story.
That gave rise to a new time pricingstrategy, dimension (DIM) pricing. . Density plays a role in the form of dimensional pricing. DIM pricing considers cubic volume in addition to physical height, width and depth of packages as a factor for price calculations. Capture pricing data for LTL freight.
Judah Levine Optimize your logistics tendering, vendor selection, negotiations, and procurement Book a Demo Weekly highlights Ocean rates – Freightos Baltic Index Asia-US West Coast prices (FBX01 Weekly) increased 3% to $1,609/FEU. Asia-US East Coast prices (FBX03 Weekly) climbed 7% to $2,357/FEU. kg China – N.
This is where pest control business software comes in as part of a robust pest control strategy, offering tools to optimize processes, enhance customer satisfaction and drive profitability by bypassing old manual processes. Pricing PestPac does not publish pricing publicly. Pricing Briostack does not list its pricing online.
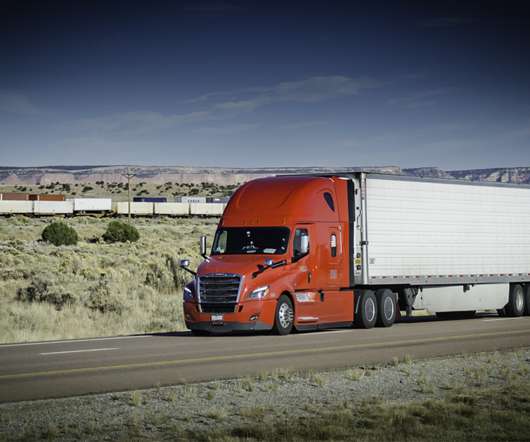
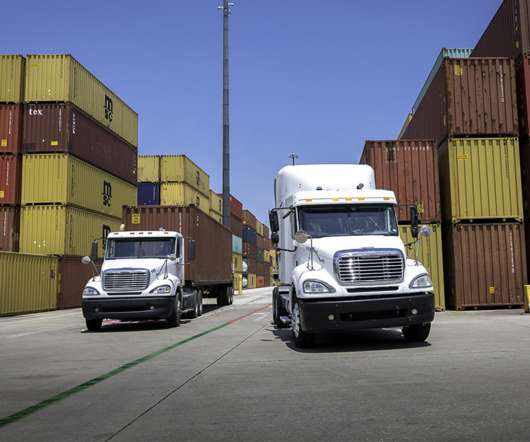
Although many carriers have worked diligently towards reducing operational costs and increasing profit margins, there is still work to do for the top for-hire truckload freight carriers to improve. Freight data reduces dwell time and load time. Operational costs continue to increase for carriers year to year.
Judah Levine November 15, 2023 Optimize your logistics tendering, vendor selection, negotiations, and procurement with Freightos Data Book a Demo Weekly highlights Ocean rates – Freightos Baltic Index Asia-US West Coast prices (FBX01 Weekly) increased 6% to $1,711/FEU. Europe prices (FBX11 Weekly) increased 11% to $1,381/FEU.
However, the sheer amount of fees applied in the process to price freight for a load can amount to quite a hefty sum. . But knowing what’s happening based on historic, peer and market data can help shippers figure out how carriers price freight loads. ” This means knowing how a carrier or shipper approaches freight pricing.
billion rate data points monthly to provide the most comprehensive view of the market, helping you identify savings opportunities and make data-driven decisions. It creates a single source of truth for your rate management, automating RFQs and streamlining the entire procurement process. Ready to Transform Your Freight Operations?
April 29, 2025 Blog Weekly highlights Ocean rates – Freightos Baltic Index Asia-US West Coast prices (FBX01 Weekly) fell 1% to $2,328/FEU. Asia-US East Coast prices (FBX03 Weekly) fell 2% to $3,395/FEU. Europe prices (FBX11 Weekly) stayed level at $2,337/FEU. America weekly prices increased 1% to $5.58/kg.
For managers in the transportation industry, freight load pricing accuracy remains a source of confusion and disruption. Remember that carrier pricing is subject to the following: Market conditions can change quickly and shift hour by hour at times. . Click the button below to request a FreightWaves SONAR demo.
This feature is particularly beneficial for LSPs preparing tenders or tariff proposals, as it provides a structured approach to pricing. To see our Matrix Creator App in action, click on the image and explore the interactive demo. Minimum Travel Time Optimize routes to reduce time spent on the road.
And if shippers know more about how carriers price freight, they are better able to identify those trends based on market signals and pre-empt carrier pricing changes. . Generate stronger, more proactive carrier pricingstrategies based on near-real-time data insights . Request a SONAR Demo. Consider this fact.
Fuel costs: Last-mile fuel costs require careful management as they make up 25% of a truck’s operational costs over volatile price fluctuations. Read also: A Study of Unit Economics in Last Mile Delivery Is it essential to reduce last-mile delivery costs for vehicles? These include: 1.
The right purchasing and logistics strategies give companies an edge during these unique, uncertain times and, during the return “to normal,” a greater competitive advantage and continued growth. Rapid cost increases, interest rate hikes and reduced demand require more effective inventory management and forecasting attention.
These include delivery windows, number of delivery stops on a specific route, delivery pricing, etc. Using VRS helps reduce fuel costs, improve operational efficiency and increase delivery speed. Schedule a OneRail demo to see how our platform tailors a solution for your specific supply chain workflow needs.
Judah Levine November 28, 2023 Optimize your logistics tendering, vendor selection, negotiations, and procurement with Freightos Data Book a Demo Weekly highlights Ocean rates – Freightos Baltic Index Asia-US West Coast prices (FBX01 Weekly) increased 3% to $1,613/FEU. Europe prices (FBX11 Weekly) fell 6% to $1,211/FEU.
Yes, the need for shipping demand analytics is not new and was echoed in 2013 by Industry Week , “Relying on traditional supply chain execution systems is becoming increasingly more difficult, with a mix of global operating systems, pricing pressures and ever-increasing customer expectations. Request a SONAR Demo.
In this blog post, we will delve into the intricacies of order management, the role of an Order Management System (OMS), what happens after checkout and how to master your order management strategy with the help of cutting-edge order management systems and order management software. What Is Order Management?
This not only wastes time but costs your business opportunitiesespecially when your competitors are using smarter tools and strategies. Fast replies, clear pricing, real-time tracking, and reliable service are now expectednot optional. Some prospects may get confused about your pricing or services. Do you offer better pricing?
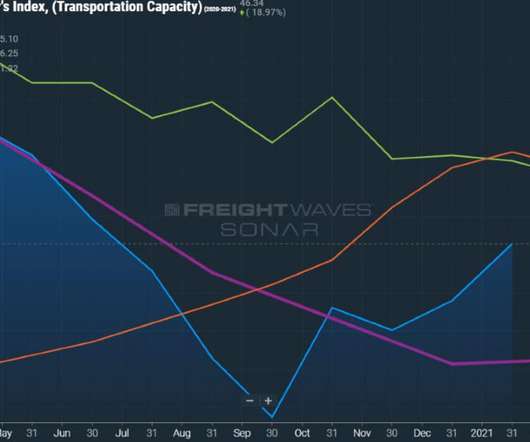
(Graphics created by Emily Ricks) Carriers frequently find themselves frustrated when costs eat away at their profits and they have limited pricing visibility. Financial losses or declining profitability certainly make cost-cutting a priority. Using freight indices assists significantly in finding the most appropriate pricing ranges.
Using technology to drive strategy and improve performance—and ultimately create financial value—is top of mind for shippers today managing complex global supply chains. But taking that data and turning it into an actionable strategy is challenging, especially if you are pulling the data from multiple platforms.
Judah Levine December 6, 2023 Optimize your logistics tendering, vendor selection, negotiations, and procurement with Freightos Data Book a Demo Weekly highlights Ocean rates – Freightos Baltic Index Asia-US West Coast prices (FBX01 Weekly) were level at $1,620/FEU. Europe prices (FBX11 Weekly) increased 3% to $1,243/FEU.
It may be off a lower-than-normal base price but for importers and exporters suffering from lower sales, it’s almost certainly troubling news. The decrease in logistics costs led 35% of importers to lower their product prices, possibly contributing to the easing of inflation rates.
This innovative approach leverages cutting-edge technology and transport optimization to cater to the evolving expectations of modern customers, emphasizing delivery speed and affordability in the delivery process. RouteManagers last-mile delivery software helps you cut fuel costs, increase revenue, and improve operations.
There’s a broad range of options to reduce rates and increase carrier revenue. Track truckload freight accessorial costs As reported by Inbound Logistics , “Carriers price accessorials, such as liftgate or non-commercial delivery, at a premium. Review transportation pricing and contracts regularly.
This means that companies with access to near-real-time data could potentially save by the elimination of lagging data. Spot data and contract data, including paid invoice rates, come together to fuel your strategy. Fuel and energy data also provide useful information in preparing a strategy. Request a SONAR Demo.
They tend to follow similar lines and influence services and prices throughout transportation networks. According to Supply Chain 24/7 , “ truckload service optimizes trailer space and moves freight [without extra stops that will] eliminate wasted trips, reducing greenhouse gas emissions by up to 40%.”
Judah Levine November 21, 2023 Optimize your logistics tendering, vendor selection, negotiations, and procurement with Freightos Data Book a Demo Weekly highlights Ocean rates – Freightos Baltic Index Asia-US West Coast prices (FBX01 Weekly) decreased 8% to $1,573/FEU. Europe prices (FBX11 Weekly) decreased 7% to $1,291/FEU.
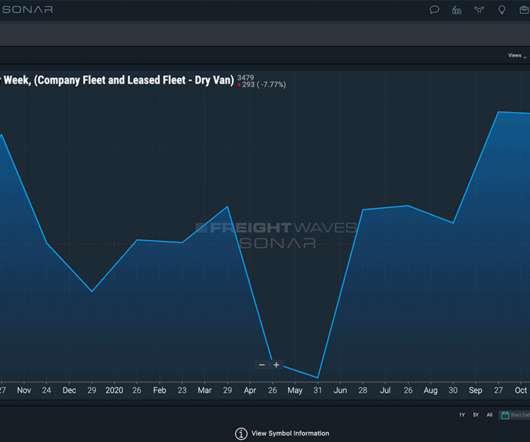
Figuring out the best strategy for managing fleet assets can be difficult at best. Unlike contracted rates, the spot freight market is full of wild price swings and uncertainty. Even with the big decline last year, spot prices have averaged 2%. Consideration of backhaul opportunities to eliminate deadheading in trucking.
Judah Levine November 19, 2024 Get Started Weekly highlights Ocean Rates – Freightos Baltic Index Asia-US West Coast prices (FBX01 Weekly) increased 3% to $5,345/FEU. Asia-US East Coast prices (FBX03 Weekly) fell 1% to $5,395/FEU. Europe prices (FBX11 Weekly) increased 2% to $4,580/FEU. kg China – N.
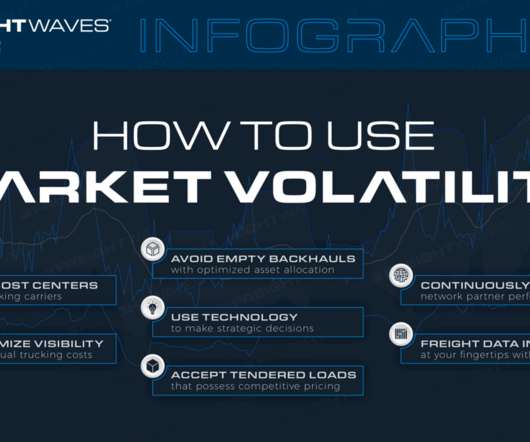
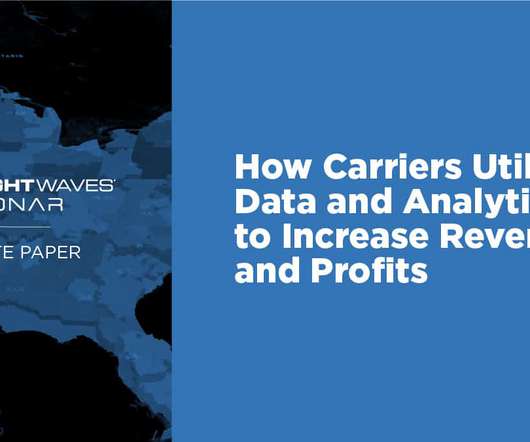
How carriers create data-driven pricingstrategies. Request a SONAR Demo. To help carriers learn how to apply and deploy data more effectively, this white paper will explore: The uses of data to allocate and manage assets. The applications of analytics to navigate market volatility.
Judah Levine December 13, 2023 Optimize your logistics tendering, vendor selection, negotiations, and procurement with Freightos Data Book a Demo Weekly highlights Ocean rates – Freightos Baltic Index Asia-US West Coast prices (FBX01 Weekly) fell 1% to $1,603/FEU. Asia-US East Coast prices (FBX03 Weekly) climbed 5% to $2,497/FEU.
We organize all of the trending information in your field so you don't have to. Join 84,000+ users and stay up to date on the latest articles your peers are reading.
You know about us, now we want to get to know you!
Let's personalize your content
Let's get even more personalized
We recognize your account from another site in our network, please click 'Send Email' below to continue with verifying your account and setting a password.


Let's personalize your content